Erratum to “Premonitory Symptoms in Migraine: Implications for Disease Burden and Cognitive Impairment, with Some Promising Answers”
Article information
Headache Pain Res. 2025;26(3):232-232
Publication date (electronic) : 2025 August 20
doi :
https://doi.org/10.62087/hpr.2024.0031.e1

This is a correction to an already published paper (Headache Pain Res 2025;26(2):130-141; https://doi.org/10.62087/hpr.2024.0031). We found errors in the IQR values in Tables 1 and 3. Appropriately adjusted are as below.
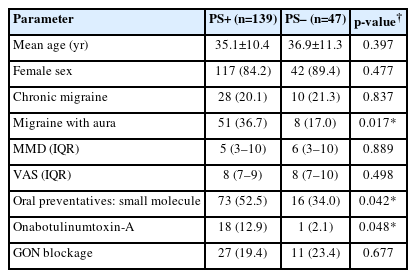
Comparison of demographic features between the PS+ and PS– groups
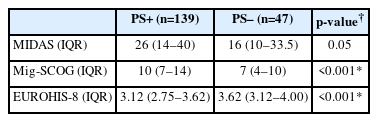
Comparison of the PS+ and PS– groups in terms of migraine trigger factors
This error does not change the text and the conclusions of our paper. We apologize for the unintentional mistake and appreciate the opportunity to correct and clarify the issue.
Notes
CONFLICT OF INTEREST
No potential conflict of interest relevant to this article was reported.
Article information Continued
© 2025 The Korean Headache Society