
Articles
- Page Path
- HOME > Headache Pain Res > Volume 27(1); 2026 > Article
-
Original Article
The Impact of Anti-Calcitonin Gene-Related Peptide Monoclonal Antibodies on Sleep Quality and Daytime Sleepiness in Migraine Patients: A Multicenter Study -
Rita Cagigal1,*
 , Ângelo Fonseca2,*, Bárbara Martins3, Catarina Fernandes4, Sandra Palma5, Carolina Guerreiro6, Carla Morgado7, Diana Valente8, Miguel Miranda9, Joana Silva10, Miguel Saianda-Duarte11, Sofia Casanova1, Mariana Branco1, Ana Luísa Rocha1, Henrique Delgado12, Elsa Parreira5, Filipe Palavra13
 -
Headache and Pain Research 2026;27(1):43-51.
DOI: https://doi.org/10.62087/hpr.2025.0022
Published online: January 28, 2026
1Neurology Department, Unidade Local de Saúde de Gaia e Espinho, Porto, Portugal
2Neurology Department, Unidade Local de Saúde de Matosinhos, Porto, Portugal
3Neurology Department, Unidade Local de Saúde de São João, Porto, Portugal
4Neurology Department, Unidade Local de Saúde de Coimbra, Coimbra, Portugal
5Neurology Department, Hospital Garcia de Orta, Unidade Local de Saúde de Almada/Seixal, Lisboa, Portugal
6Neurology Department, Unidade Local de Saúde de Lisboa Central, Lisboa, Portugal
7Neurology Department, Unidade Local de Saúde de Braga, Braga, Portugal
8Neurology Department, Unidade Local de Saúde do Algarve, Faro, Portugal
9Functional Neurology Unit, Hospital de Cascais Dr. José de Almeida, Lisboa, Portugal
10Neurology Department, Hospital Fernando Fonseca, Unidade Local de Saúde de Amadora-Sintra, Lisboa, Portugal
11Neurology Department, Hospital Beatriz Ângelo, Unidade de Saúde Local Loures-Odivelas, Lisboa, Portugal
12Neurology Department, Hospital das Forças Armadas de Lisboa, Lisboa, Portugal
13Center for Child Development – Neuropediatrics Unit, Hospital Pediátrico, Unidade Local de Saúde de Coimbra, Coimbra, Portugal
- Correspondence: Rita Cagigal, M.D. Neurology Department, Unidade Local de Saúde de Gaia e Espinho, Rua Conceição Fernandes 4434-502 Vilar de Andorinho, Vila Nova de Gaia, Porto, Portugal Tel: +351-22-786-5100, Fax: +351-22-783-0209, E-mail: 13909@ulsge.min-saude.pt
- *These authors contributed equally to this study as co-first authors.
© 2026 The Korean Headache Society
This is an Open Access article distributed under the terms of the Creative Commons Attribution Non-Commercial License (https://creativecommons.org/licenses/by-nc/4.0) which permits unrestricted non-commercial use, distribution, and reproduction in any medium, provided the original work is properly cited.
- 1,620 Views
- 39 Download
Abstract
-
Purpose
- This study aimed to determine whether patients with migraine experience improvements in self-reported sleep quality and daytime sleepiness after starting monoclonal antibody (mAb) therapy targeting the calcitonin gene-related peptide (CGRP) or its receptor, and to explore the association between treatment efficacy and improvements in sleep quality.
-
Methods
- This prospective, multicenter, observational, longitudinal study was conducted across 12 headache centers. Adults with episodic or chronic migraine who began anti-CGRP mAb therapy were assessed at baseline, 3 months, and 6 months. Sleep quality and daytime sleepiness were evaluated using the Portuguese version of the Pittsburgh Sleep Quality Index (PSQI-PT) and the Portuguese version of the Epworth Sleepiness Scale (ESS-PT), respectively.
-
Results
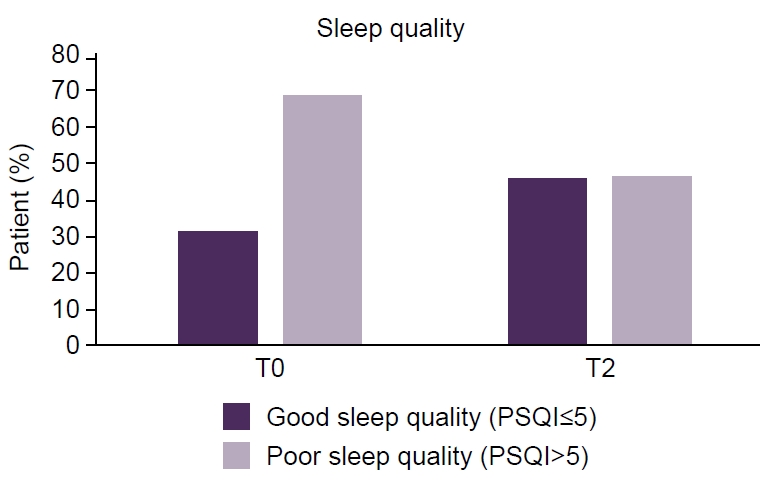
- Of 118 enrolled patients, 109 completed the study (86.4% female; mean age, 43.6 years). A significant improvement in sleep quality was observed, with median PSQI-PT scores decreasing from 9 at baseline to 6 at 6 months (p<0.001). Daytime sleepiness also improved, with median ESS-PT scores decreasing from 7 to 6 (p=0.04). Migraine frequency decreased significantly, from a median of 13 to 4 monthly migraine days (p<0.001). Greater migraine improvement was independently associated with greater PSQI-PT improvement (p<0.001), whereas changes in ESS-PT were not correlated with treatment efficacy.
-
Conclusion
- Anti-CGRP mAb therapy was associated with significant improvements in sleep quality, likely mediated through migraine relief. Changes in ESS-PT were not correlated with treatment efficacy, suggesting a possible interaction between migraine mechanisms and CGRP-mediated sleep–wake regulation. Future research should focus on clarifying the mechanisms underlying these associations.
INTRODUCTION
MATERIALS AND METHODS
RESULTS
DISCUSSION
AVAILABILITY OF DATA AND MATERIAL
The datasets generated and analyzed during the current study are available upon reasonable request from the corresponding author.
AUTHOR CONTRIBUTIONS
Conceptualization: RC, AF, BM, CF, HD, EP, FP; Data curation: RC, AF, BM, CF, SP, CG, CM, DV, MM, JS, MSD, SC, MB, ALR, HD, EP, FP; Formal analysis: RC, AF, BM, CF, HD, EP, FP; Investigation: RC, AF, BM, CF, HD, EP, FP; Methodology: RC, AF, BM, CF, HD, EP, FP; Supervision: HD, EP, FP, Validation: HD, EP, FP; Writing–original draft: RC, AF, BM, CF, SP, CG, CM, DV, MM, JS, MSD, SC, MB, ALR, HD, EP, FP; Writing–review & editing: RC, AF, BM, CF, SP, CG, CM, DV, MM, JS, MSD, SC, MB, ALR, HD, EP, FP.
CONFLICT OF INTEREST
No potential conflict of interest relevant to this article was reported.
FUNDING STATEMENT
Not applicable.
ACKNOWLEDGMENTS
The authors would like to thank all participating patients and the clinical teams from the twelve collaborating headache centers for their invaluable contribution to data collection and follow-up.


| Baseline feature | Completed the study (n=109) | Discontinued (n=9) | All (n=118) |
|---|---|---|---|
| Sex, female | 94 (86.2) | 8 (88.9) | 102 (86.4) |
| Age (yr)* | 44.2 (24–74) | 41.1 (29–65) | 43.6 (24–74) |
| BMI (kg/m2) | 24.11 (15.81–42.32) | 22.78 (18.31–25.13) | 23.87 (15.81–42.32) |
| Sleep disorder, yes | 42 (38.5) | 2 (22.2) | 44 (37.3) |
| Use of sleep medication, yes | 36 (33.0) | 4 (44.4) | 40 (33.9) |
| Migraine† | |||
| Episodic | 52 | 44 | 52 |
| Without aura | 82 | 78 | 81 |
| Chronic | 48 | 56 | 48 |
| Antibody† | |||
| Fremanezumab (225 mg, monthly) | 63 | 100 | 66 |
| Galcanezumab (120 mg, monthly) | 24 | - | 22 |
| Erenumab (70 or 140 mg, monthly) | 13 | - | 12 |
| Number of prophylactic drugs at T0 | 1 (0.5) | 1 (1.0) | 1 (0.5) |
Values are presented as median (interquartile range). The p-values refer to the Friedman test across time points. The pairwise Wilcoxon signed-rank test with false discovery rate correction confirmed significance at T1 and T2 versus T0. The median reduction in PSQI-PT from T0 to T2 was 3 points (33% improvement), representing an absolute decrease in subjective sleep disturbance.
PSQI-PT, Portuguese version of the Pittsburgh Sleep Quality Index; ESS-PT, Portuguese version of the Epworth Sleepiness Scale; T0, baseline; T1, 3 months; T2, 6 months.
- 1. Headache Classification Committee of the International Headache Society. The International Classification of Headache Disorders 3rd edition. International Headache Society; 2018.
- 2. Frimpong-Manson K, Ortiz YT, McMahon LR, Wilkerson JL. Advances in understanding migraine pathophysiology: a bench to bedside review of research insights and therapeutics. Front Mol Neurosci 2024;17:1355281.ArticlePubMedPMC
- 3. Waliszewska-Prosół M, Nowakowska-Kotas M, Chojdak-Łukasiewicz J, Budrewicz S. Migraine and sleep: an unexplained association? Int J Mol Sci 2021;22:5539.ArticlePubMedPMC
- 4. Vgontzas A, Pavlović JM. Sleep disorders and migraine: review of literature and potential pathophysiology mechanisms. Headache 2018;58:1030-1039.ArticlePubMedPMCPDF
- 5. Sullivan DP, Martin PR. Sleep and headaches: relationships between migraine and non‐migraine headaches and sleep duration, sleep quality, chronotype, and obstructive sleep apnoea risk. Aust J Psychol 2017;69:210-217.ArticlePDF
- 6. Stanyer EC, Creeney H, Nesbitt AD, Holland PR, Hoffmann J. Subjective sleep quality and sleep architecture in patients with migraine: a meta-analysis. Neurology 2021;97:e1620-e1631.ArticlePubMedPMC
- 7. Wattiez AS, Sowers LP, Russo AF. Calcitonin gene-related peptide (CGRP): role in migraine pathophysiology and therapeutic targeting. Expert Opin Ther Targets 2020;24:91-100.ArticlePubMedPMC
- 8. Giffin NJ. Calcitonin gene-related peptide (CGRP) monoclonal antibodies for migraine. Pract Neurol 2023;23:200-207.ArticlePubMed
- 9. Drellia K, Kokoti L, Deligianni CI, Papadopoulos D, Mitsikostas DD. Anti-CGRP monoclonal antibodies for migraine prevention: a systematic review and likelihood to help or harm analysis. Cephalalgia 2021;41:851-864.ArticlePubMedPDF
- 10. Kunst M, Hughes ME, Raccuglia D, et al. Calcitonin gene-related peptide neurons mediate sleep-specific circadian output in Drosophila. Curr Biol 2014;24:2652-2664.ArticlePubMedPMC
- 11. Pellitteri G, Pez S, Nilo A, et al. Erenumab impact on sleep assessed with questionnaires and home-polysomnography in patients with migraine: the ERESON study. Front Neurol 2022;13:869677.ArticlePubMedPMC
- 12. Viticchi G, Di Stefano V, Altamura C, et al. Effects of prophylactic drug therapies and anti-calcitonin peptide-related monoclonal antibodies on subjective sleep quality: an Italian multicenter study. Sleep Med 2024;117:87-94.ArticlePubMed
- 13. Del Rio João KA, Becker NB, de Neves Jesus S, Isabel Santos Martins R. Validation of the Portuguese version of the Pittsburgh Sleep Quality Index (PSQI-PT). Psychiatry Res 2017;247:225-229.ArticlePubMed
- 14. Johns MW. Escala de Sonolência de Epworth-versão portuguesa (ESS-PT) [Internet]. Sleep Disorders Unit, Epworth Hospital; 1991 [cited 2025 Oct 2]. Available from: https://www.heldernovaisbastos.pt/ficheiros/escala_de_sonolencia_epworth_.pdf
- 15. Iannone LF, Boccalini A, Lo Castro F, et al. Effect of atogepant on sleep quality and sleep-related adverse events in adult patients with migraine: a prospective observational 12-week study. CNS Drugs 2025;39:1341-1354.ArticlePubMedPMCPDF
REFERENCES
Figure & Data
References
Citations
 PubReader
 ePub Link
-
 Cite this Article
- Cite this Article
-
- Close
- Download Citation
- Close
- Figure
-
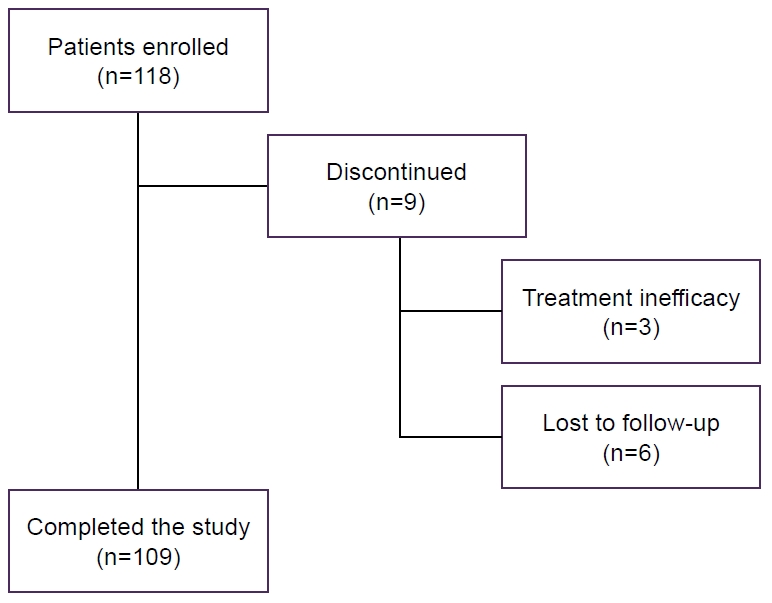

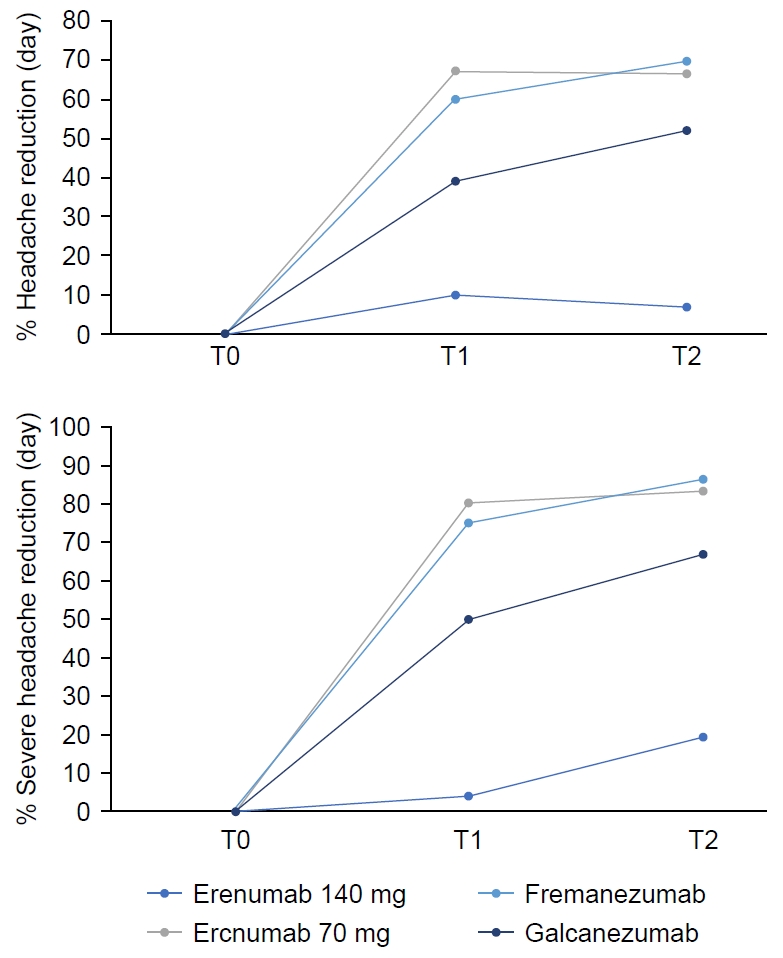


Figure 1.
Figure 2.
Figure 3.
| PSQI-T0 | PSQI-T2 | p-value | |
|---|---|---|---|
| Age | 0.543 | ||
| Sex | 0.855 | ||
| BMI | 0.515 | ||
| Aura | 0.906 | ||
| Yes | 9 (9) | 6 (9) | |
| No | 9 (9) | 5 (8) | |
| Sleep medication use | 0.341 | ||
| Yes | 8 (8) | 5 (8) | |
| No | 11.5 (7) | 8 (9) | |
| Episodic vs. chronic | 0.247 | ||
| Episodic | 8 (7) | 5 (9) | |
| Chronic | 10 (6) | 7 (9) | |
| Sleep medication after T0 | 0.375 | ||
| Yes (n=9) | 8 (7) | 6 (10) | |
| No (n=100) | 12 (9) | 12 (4) | |
| Effective treatment | 0.007* | ||
| Yes (n=72) | 9 (9) | 5 (5) | <0.001* |
| No (n=37) | 8 (8) | 8 (9) | 0.099 |
| Baseline feature | Completed the study (n=109) | Discontinued (n=9) | All (n=118) |
|---|---|---|---|
| Sex, female | 94 (86.2) | 8 (88.9) | 102 (86.4) |
| Age (yr) |
44.2 (24–74) | 41.1 (29–65) | 43.6 (24–74) |
| BMI (kg/m2) | 24.11 (15.81–42.32) | 22.78 (18.31–25.13) | 23.87 (15.81–42.32) |
| Sleep disorder, yes | 42 (38.5) | 2 (22.2) | 44 (37.3) |
| Use of sleep medication, yes | 36 (33.0) | 4 (44.4) | 40 (33.9) |
| Migraine |
|||
| Episodic | 52 | 44 | 52 |
| Without aura | 82 | 78 | 81 |
| Chronic | 48 | 56 | 48 |
| Antibody |
|||
| Fremanezumab (225 mg, monthly) | 63 | 100 | 66 |
| Galcanezumab (120 mg, monthly) | 24 | - | 22 |
| Erenumab (70 or 140 mg, monthly) | 13 | - | 12 |
| Number of prophylactic drugs at T0 | 1 (0.5) | 1 (1.0) | 1 (0.5) |
| T0 | T1 | T2 | p-value | |
|---|---|---|---|---|
| PSQI-PT score | 9 (9) | 7 (6) | 6 (5) | <0.001 |
| ESS-PT score | 7 (8) | 6 (8) | 6 (8) | 0.04 |
| Days with pain | 13 (8) | 5 (7) | 4 (7) | <0.001 |
| Reduction (day), % | 58.3 (37) | 70 (48) | ||
| Days with severe pain | 10 (7) | 2 (7) | 2 (4) | <0.001 |
| Reduction, % | 6.5 (5) | 6 (6.5) | ||
| SOS use (day) | 10 (8) | 2 (4) | 2 (5) | <0.001 |
| Reduction, % | 71.4 (42) | 75 (50) |
| ESS-T0 | ESS-T2 | p-value | |
|---|---|---|---|
| Age | 0.112 | ||
| Sex | 0.752 | ||
| BMI | 0.834 | ||
| Aura | 0.248 | ||
| Yes | 7 (8) | 6 (8) | |
| No | 7 (5) | 5 (6) | |
| Sleep medication use | 0.209 | ||
| Yes | 8 (9) | 6 (9) | |
| No | 6 (3) | 5 (9) | |
| Episodic vs. chronic | 0.071 | ||
| Episodic | 8 (7) | 6 (9) | |
| Chronic | 6 (4) | 5.5 (6) | |
| Sleep medication after T0 | 0.010* | ||
| Yes (n=9) | 7 (8) | 6 (12) | 0.205 |
| No (n=100) | 5 (8) | 12 (7) | 0.002* |
| Effective treatment | 0.341 | ||
| Yes (n=72) | 8 (8) | 6 (8) | |
| No (n=37) | 5 (9) | 6 (9) |
Values are presented as median (interquartile range). *Asterisk indicates a statistically significant (p<0.05). PSQI, Pittsburgh Sleep Quality Index; T0, baseline; T2, 6 months; BMI, body mass index.
Values are presented as number (%) or median (range) only unless otherwise specified. BMI, body mass index; T0, baseline. Mean (range); Percent only.
Values are presented as median (interquartile range). The p-values refer to the Friedman test across time points. The pairwise Wilcoxon signed-rank test with false discovery rate correction confirmed significance at T1 and T2 versus T0. The median reduction in PSQI-PT from T0 to T2 was 3 points (33% improvement), representing an absolute decrease in subjective sleep disturbance. PSQI-PT, Portuguese version of the Pittsburgh Sleep Quality Index; ESS-PT, Portuguese version of the Epworth Sleepiness Scale; T0, baseline; T1, 3 months; T2, 6 months.
Values are presented as median (interquartile range). *Asterisk indicates a statistically significant (p<0.05). ESS, Epworth Sleepiness Scale; T0, baseline; T2, 6 months; BMI, body mass index.
Table 1.
Table 2.
Table 3.
Table 4.
TOP

