Abstract
-
Purpose
- Altered cerebrovascular reactivity has been reported in migraine; however, longitudinal changes during preventive treatment remain unclear. This observational study aimed to describe and compare longitudinal cerebrovascular responses derived from functional near-infrared spectroscopy (fNIRS) during a breath-holding test between patients treated with a calcitonin gene-related peptide (CGRP) monoclonal antibody and those receiving oral preventive medications.
-
Methods
- Twenty-four patients with migraine were enrolled (CGRP group, n=12; oral group, n=12). fNIRS over the prefrontal cortex was performed at baseline and after 3 months during a standardized breath-holding protocol. Oxygenated (HbO), deoxygenated, and total hemoglobin signals were used to derive breath-holding and recovery indices. Clinical outcomes included monthly headache days, acute medication days, disability, mood scales, and Patient Global Impression of Change.
-
Results
- Monthly headache days decreased in both groups (CGRP: Δ=–2.00, p=0.26; oral: Δ=–1.50, p=0.48), with no between-group difference (p=0.85). Acute medication days were significantly reduced only in the CGRP group (Δ=–7.00, p=0.03). Migraine Disability Assessment (MIDAS) scores improved significantly in the CGRP group (Δ=–21.25, p=0.02), with no significant between-group differences. During breath-holding, HbO increased across channels in both groups and was followed by a gradual decline during the recovery phase. Longitudinal analyses demonstrated group-dependent differences in temporal change patterns, with a treatment×time interaction reaching significance at the uncorrected level in a representative channel (Channel 6: F(1,16)=8.448, p=0.010), but not after multiple-comparison correction (p=0.155).
-
Conclusion
- fNIRS with a breath-holding challenge enables longitudinal assessment of cerebrovascular responses during migraine preventive treatment. The observed differences should be interpreted descriptively in terms of temporal change patterns. Larger studies are needed to clarify clinical significance.
-
Keywords: Breath holding, Calcitonin gene-related peptide, Migraine without aura, Monoclonal antibodies, Near-infrared spectroscopy
INTRODUCTION
Migraine is a common neurological disorder characterized by recurrent headache attacks. Increasing evidence suggests that migraine is better understood as a disorder involving abnormal activation of the trigeminovascular system rather than a purely neuronal condition.1-3 Cerebrovascular reactivity (CVR) and vasomotor reserve have been investigated in patients with migraine; however, previous studies have reported heterogeneous findings, reflecting variability in study populations, imaging modalities, and assessment paradigms rather than a consistent cerebrovascular abnormality.4-6
Calcitonin gene-related peptide (CGRP) plays a central role in migraine pathophysiology and is a potent vasodilatory neuropeptide released from trigeminal afferents during migraine attacks.7 Through its effects on trigeminovascular system, including neurogenic inflammation and modulation of cerebral arterial tone, CGRP contributes to migraine pain generation and associated vascular responses.8-10 On this basis, monoclonal antibodies targeting the CGRP pathway including fremanezumab have been developed and have demonstrated robust efficacy in reducing migraine frequency and headache-related disability.11,12
Despite these established clinical benefits, the physiological effects of CGRP monoclonal antibodies on cerebral vascular function remain incompletely understood. In particular, it is unclear whether clinical improvement following CGRP pathway inhibition is accompanied by measurable changes in CVR.13
Cerebral vasomotor reactivity refers to the capacity of cerebral arterioles to dilate or constrict in response to changes in arterial carbon dioxide tension, thereby contributing to the regulation of cerebral blood flow. This concept is distinct from cerebrovascular autoregulation, which refers to the maintenance of stable cerebral blood flow across changes in perfusion pressure.14,15 Altered CVR in migraine therefore reflects differences in CO2-mediated vasodilatory capacity rather than heightened nociceptive sensitivity or exaggerated vascular responsiveness.16,17 Neuroimaging studies using positron emission tomography, single-photon emission computed tomography, and blood oxygenation level dependent functional magnetic resonance imaging have demonstrated alterations in cerebral perfusion and cortical excitability in migraine; however, their longitudinal applicability is limited by cost, accessibility constraints, and susceptibility to motion artifacts.18,19
Functional near-infrared spectroscopy (fNIRS) is a non-invasive optical neuroimaging modality that enables continuous monitoring of cortical hemodynamic responses through quantification of oxygenated and deoxygenated hemoglobin (HbR) concentrations. Owing to its portability, safety, and relative tolerance to movement, fNIRS is well suited for longitudinal evaluation of cerebrovascular hemodynamic responses in clinical environments.20-24
The breath-holding test (BHT) is an established physiological challenge that induces transient hypercapnia for the assessment of CVR. Rising arterial carbon dioxide tension during breath-holding (BH) results in cerebral arteriolar dilation and increased cerebral blood flow, which can be reliably captured using fNIRS derived hemoglobin signals. Compared with controlled carbon dioxide inhalation paradigms, the BHT is simpler to administer, well tolerated, and widely used as a screening tool for impaired vasomotor reserve.25,26
To date, longitudinal fNIRS-based investigations directly comparing CGRP monoclonal antibody therapy with conventional oral preventive treatments remain limited, and the relationship between clinical improvement and change in cerebrovascular hemodynamic responses has not been fully clarified. Therefore, this study aimed to longitudinally and descriptively compare fNIRS-derived cerebrovascular hemodynamic responses during the BHT between migraine patients treated with fremanezumab and those receiving conventional oral preventive medications at baseline and after 3 months of treatment.
MATERIALS AND METHODS
1. Study design and participants
This prospective observational study enrolled adult patients diagnosed with migraine without aura according to the International Classification of Headache Disorders, 3rd edition (ICHD‑3). Patients with migraine with aura were excluded to minimize potential heterogeneity related to cortical spreading depolarization and its confounding effects on cerebrovascular hemodynamic responses. Both episodic migraine and chronic migraine patients were included in the study, and migraine subtype was not used as a stratification factor at enrollment. This study was designed as an observational study. Treatment selection (anti-CGRP monoclonal antibody versus oral preventive medication) was determined clinically and not by random allocation.
Inclusion criteria were as follows: age ≥18 years; diagnosis of migraine without aura according to ICHD‑3 criteria; eligibility for preventive migraine therapy with either a CGRP monoclonal antibody or a conventional oral preventive medication as determined by the treating neurologist; ability to comply with the BHT and fNIRS assessment protocol; and provision of written informed consent.
Exclusion criteria were as follows: migraine with aura or other primary headache disorders; prior cerebrovascular disease (ischemic or hemorrhagic stroke, transient ischemic attack, or significant intracranial arterial stenosis); major neurological disorders other than migraine (e.g., epilepsy, neurodegenerative disease); significant cardiovascular or respiratory disease that could interfere with CVR assessment or BH performance; use of medications known to substantially affect cerebral hemodynamics aside from prescribed preventive migraine treatments; and inability to complete baseline or follow-up fNIRS assessments.
Participants were allocated into two treatment groups: (1) CGRP monoclonal antibody group (12 patients treated with fremanezumab) and (2) oral preventive medication group (12 patients receiving conventional oral migraine preventive therapy). fNIRS assessments were performed at baseline prior to initiation of preventive treatment and at the 3‑month follow-up. The study was approved by the Institutional Review Board of Hallym University (IRB No. 2023‑09‑017), and all participants provided written informed consent in accordance with the Declaration of Helsinki.
2. Functional near-infrared spectroscopy acquisition
Hemodynamic activity was recorded using a multichannel continuous‑wave fNIRS system equipped with 24 laser sources and 32 photodetectors, yielding 48 measurement channels with a source–detector distance of 3 cm. Near‑infrared light at 780 and 850 nm was delivered at a sampling rate of 8.138 Hz, with optical output maintained below 1 mW for safety.
Optical probes were secured to the forehead using a spring‑mounted fixation system to minimize contact pressure, and rubber shielding at the probe interface was used to reduce ambient light interference. Detector gain and incident light intensity were calibrated prior to acquisition to optimize signal quality while accounting for inter‑individual differences in scalp and skull properties. Data were transmitted wirelessly to the monitoring application via Wi‑Fi.
Measurements were obtained over the prefrontal cortex, with FPz of the international 10–20 system as the anatomical anchor point for probe positioning. Estimated Montreal Neurological Institute coordinates and corresponding Brodmann areas for each channel are provided in the Supplementary Table 1 (available online).
3. Breath‑holding test protocol
All participants underwent a standardized BHT consisting of three consecutive phases (Figure 1): (1) baseline resting phase, 30 seconds of spontaneous breathing; (2) BH phase, 30 seconds of voluntary BH; and (3) recovery (Rec) phase, 30 seconds of spontaneous breathing.
Participants were instructed to perform BH for approximately 30 seconds following normal expiration while avoiding deep inspiration to minimize Valsalva‑related reductions in cerebral blood flow. During BH, increasing arterial carbon dioxide tension induces cerebral arteriolar dilation and increased cerebral blood volume, which are detectable through fNIRS derived hemoglobin signals. In accordance with previous literature, CVR was characterized using task related changes in oxygenated hemoglobin (HbO), HbR and total hemoglobin (HbT) during the BH and Rec phases.26
For BH–induced hemodynamic responses, the fNIRS signal was segmented into five consecutive 10‑second intervals (resting, BH_A, BH_B, Rec_A, Rec_B). All segments were referenced to the resting interval to enable comparison of relative temporal trajectories of HbO, HbR, and HbT. Primary indices included the BH index (BH_B–BH_A) and Rec index (Rec_A–Rec_B), computed at baseline and 3 months and compared longitudinally to characterize potential alterations in CVR (Figure 2).
4. Signal preprocessing and feature extraction
Raw optical intensity signals were preprocessed using a standardized pipeline. A band-pass filter (0.005–0.20 Hz) was applied to attenuate slow drifts and high-frequency physiological noise. Motion artifacts were corrected using the temporal derivative distribution repair algorithm, and channels were excluded when the coefficient of variation exceeded 15%.
To further improve cortical signal quality, short-channel regression was applied using the mean signal from 8‑mm short‑separation channels to reduce superficial physiological contamination. Optical density signals were subsequently converted to concentration changes using the modified Beer–Lambert law (MBLL), with MBLL coefficients derived from Moaveni’s calculation. Differential pathlength factors were not applied in order to preserve relative hemoglobin contrast values.
For each channel, block‑averaged HbO, HbR, and HbT signals were extracted across the predefined task epochs. Primary cerebrovascular indices included the BH index (BH index=BH_B–BH_A) and the Rec index (Rec index=Rec_A–Rec_B), which were computed at baseline and again at 3 months to characterize longitudinal changes in hypercapnia‑related hemodynamic responses.
5. Statistical analysis
Sample size adequacy was evaluated using a priori power analysis performed with G*Power 3.1. Between-group differences in continuous demographic variables were analyzed using independent samples t-tests, and categorical variables were compared using the chi‑square test. Continuous data are reported as mean±standard deviation, and effect estimates are summarized as mean change scores (Δ). Within‑group changes from baseline to 3 months were evaluated using paired t-tests, and between-group differences in Δ values were assessed using independent samples t‑tests.
To determine whether longitudinal changes in fNIRS derived indices differed between treatment groups, a two-way repeated‑measures ANOVA was performed with Group (CGRP vs. oral preventive) as the between subject factor and Time (baseline vs. 3 months) as the within subject factor. Post‑hoc pairwise comparisons were conducted when significant interaction effects were present. Statistical significance was defined as p<0.05. Analyses were performed using SPSS version 21.0 (IBM Corp.).
The preprocessing and statistical analysis pipeline was adapted from our previously published methodology.22
6. Clinical and patient-reported outcome measures
Clinical and patient reported outcomes were assessed two times: baseline (prior to treatment initiation) and 3-month follow-up. The following headache-related and psychological symptom scales were administered at both time points: monthly headache days (day/mo), monthly acute medication days (day/mo), Headache Impact Test-6 (HIT-6), Migraine Disability Assessment (MIDAS), Generalized Anxiety Disorder-7 (GAD-7), and Patient Health Questionnaire-9 (PHQ-9). These measures were used to evaluate headache burden, functional disability, and mood symptoms associated with migraine.
HIT-6 is a widely used instrument that quantifies headache-related functional impact, with higher scores indicating greater headache-related disability. MIDAS assesses headache disability based on activity loss over the preceding 3 months, and scores are categorized into minimal, mild, moderate, and severe disability levels. GAD-7 and PHQ-9 were administered as screening measures for anxiety and depressive symptoms, respectively, with higher scores reflecting greater symptom severity.27-30
In addition, the Patient Global Impression of Change (PGIC) was administered only at the 3-month follow-up to assess patients’ subjective perception of improvement following treatment. The PGIC is a 7-point scale in which higher ratings indicate greater perceived overall improvement.31
RESULTS
Baseline demographic characteristics did not differ significantly between the CGRP monoclonal antibody group and the oral preventive medication group. Age, sex distribution, height, body weight, and body mass index were comparable between-groups (all p>0.05) (Table 1).
At 3 months, monthly headache days numerically decreased in both groups; however, the within group changes did not reach statistical significance (CGRP: Δ=–2.00, p=0.26; oral: Δ=–1.50, p=0.48), and there was no significant between-group difference (p=0.85). Acute medication days were significantly reduced in the CGRP group (Δ=–7.00, p=0.03) but not in the oral group (Δ=–3.50, p=0.19), with no significant between-group difference (p=0.36). HIT-6 and MIDAS scores improved in both groups; however, only the reduction in MIDAS was significant in the CGRP group (Δ=–21.25, p=0.02), while changes in the oral group were not significant (HIT-6: p=0.05; MIDAS: p=0.11), and no between-group differences were observed (both p=0.55). GAD-7 and PHQ-9 changes were modest and non-significant in both groups (all p>0.05). PGIC scores at 3 months were numerically higher in the CGRP group than in the oral group (4.50 vs. 3.42), without a significant between-group difference (p=0.15) (Table 2).
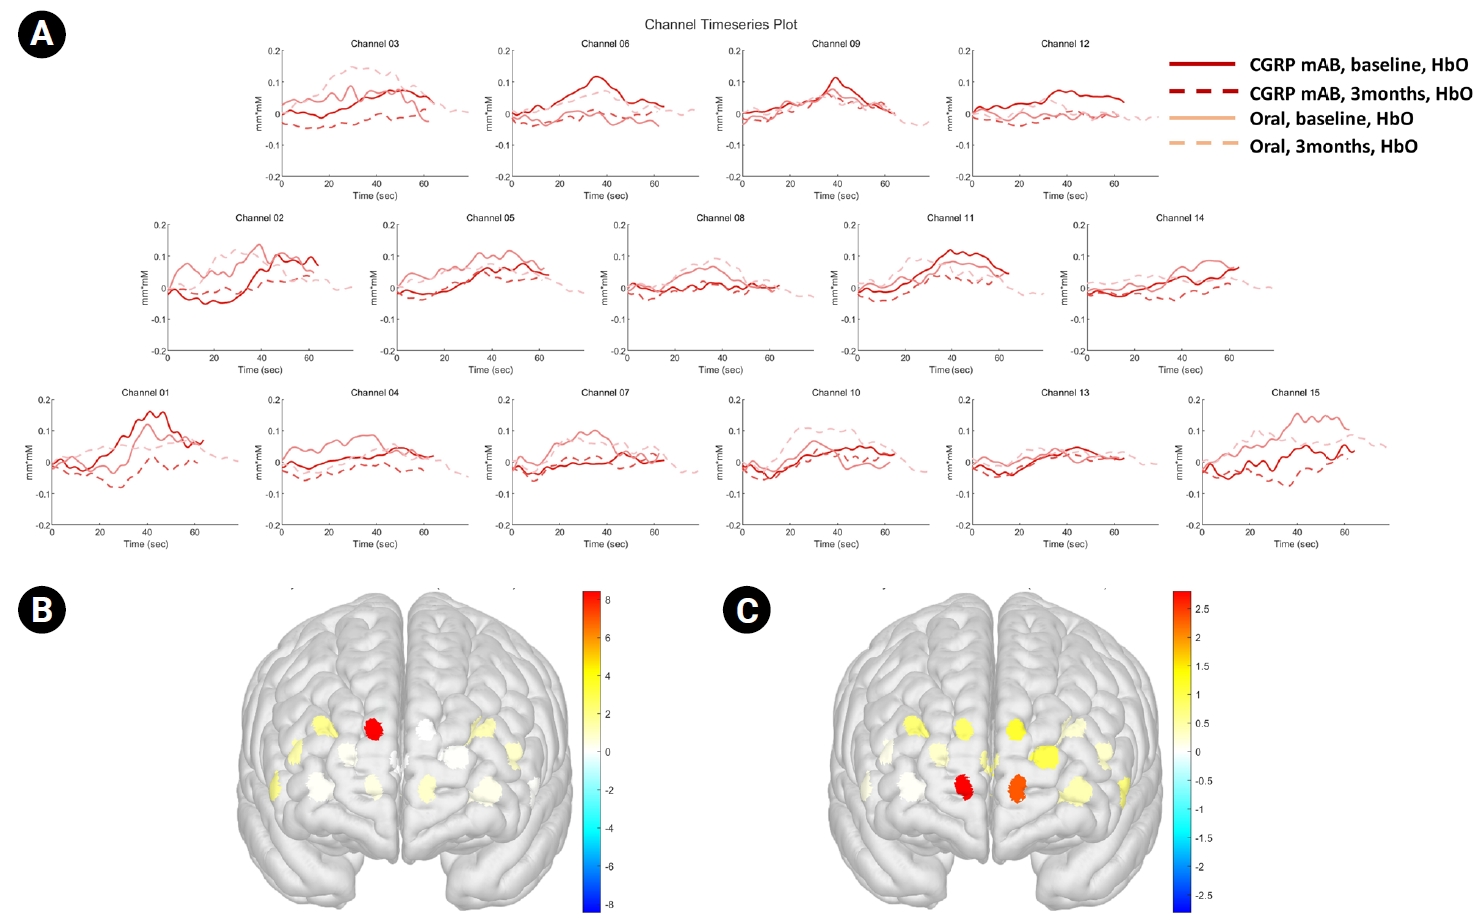
During the BH phase, both the CGRP monoclonal antibody group and the oral preventive medication group showed numerical increases in HbO across multiple prefrontal channels. In channel 06, HbO increased from 0.003 at baseline to 0.117 at the end of BH in the CGRP group and from –0.011 to 0.006 in the oral preventive medication group. During the Rec phase, HbO values in both groups numerically decreased toward pre-task levels, reaching 0.033 in the CGRP group and 0.022 in the oral preventive medication group by the end of Rec. Similar patterns were observed across the majority of channels, although the magnitude of change varied by channel and time point (Figure 3).
Two-way ANOVA revealed no significant group×time interaction effects across channels after correction for multiple comparisons for the HbO-based BH index (Table 3). Although channel 06 showed a nominally significant interaction at the uncorrected level (F(1,16)=8.448, p=0.010), this effect did not remain significant after family-wise error or false discovery rate correction (both corrected p=0.155), and no other channels demonstrated significant interaction effects.
Post hoc analyses focusing on channel 06 (Figure 4) demonstrated a significant difference between the CGRP group at baseline and the oral treatment group at 3 months (mean difference=0.169, p<0.001), which remained significant after Bonferroni correction. In contrast, the within group change from baseline to 3 months in the oral treatment group was significant only at the uncorrected level (mean difference=–0.069, p=0.029) and did not remain significant after correction for multiple comparisons.
Analyses of HbR- and HbT-based BH indices showed no significant group×time interaction effects after correction for multiple comparisons, with only nominal uncorrected effects in a few channels. Detailed results are presented in the Supplementary Tables 2, 3 (available online).
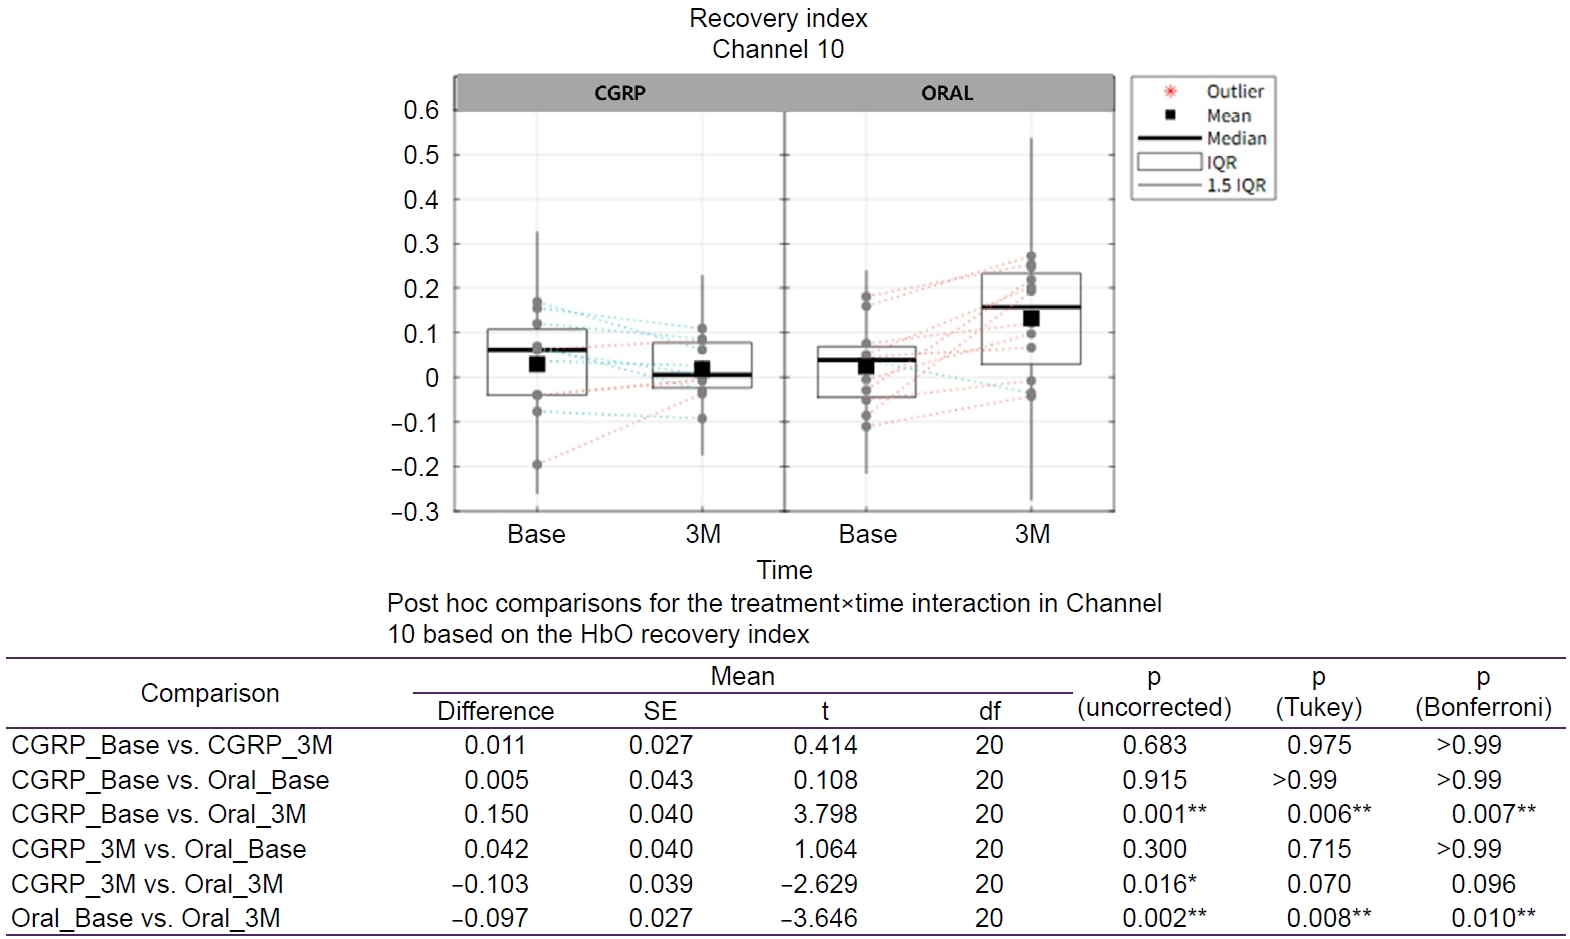
For the HbO-based Rec index, two-way ANOVA identified no significant treatment×time interaction effects across channels after correction for multiple comparisons (Table 4). Channel 10 showed a significant interaction at the uncorrected level (F(1,20)=8.242, p=0.009); however, this effect did not persist after family-wise error or false discovery rate correction (both corrected p=0.142), and no other channels showed significant interaction effects.
Post hoc analyses in channel 10 (Figure 5) revealed a significant difference between the CGRP group at baseline and the oral treatment group at 3 months (mean difference=0.150, p=0.001), which remained significant after Bonferroni correction (p=0.007). Additionally, a significant within group change was observed in the oral treatment group from baseline to 3 months (mean difference=–0.097, p=0.002), which also remained significant after Bonferroni correction (p=0.010).
Analyses of HbR and HbT based Rec indices revealed no significant treatment×time interaction effects after multiple comparison correction; detailed results are reported in the Supplementary Tables 4, 5 (available online).
DISCUSSION
This longitudinal fNIRS study examined whether clinical improvement following migraine preventive therapy is accompanied by changes in CVR during a hypercapnic challenge. Although both the CGRP monoclonal antibody group and the oral preventive medication group demonstrated clinically meaningful improvements over 3 months, these benefits were not uniformly associated with normalization of cerebrovascular hemodynamic responses. This dissociation suggests that symptomatic improvement in migraine may occur, at least in part, independently of restoration of altered CVR.
Cerebral blood flow is tightly regulated by arterial carbon dioxide tension, and within a physiologically relevant range, variation in pCO2 produces dose‑dependent vasodilatory or vasoconstrictive responses. The resulting sigmoidal relationship reflects the degree of preserved vasomotor reactivity within the remaining autoregulatory reserve of the cerebrovascular system.14 In this physiological context, the BHT provides a transient hypercapnic stimulus suitable for evaluating vasodilatory capacity across resting, BH, and Rec phases. In individuals with preserved vasomotor reserve, rising pCO2 during BH is expected to induce arteriolar dilation and increases in HbO and HbT, whereas in those with reduced reserve, hypercapnia‑induced increases may be attenuated or plateaued, reflecting limited residual dilatory capacity.26,32
In our cohort, the CGRP monoclonal antibody group showed a longitudinal decrease in both the BH and Rec indices, whereas the oral preventive medication group demonstrated an opposite pattern, with an increase in these indices from baseline to 3 months. These divergent temporal trajectories suggest that cerebrovascular responses may evolve differently over time between the two treatment groups. However, we caution against inferring a direct mechanistic effect of CGRP-targeted therapy on CVR from these findings alone.33 The attenuation of the CO2‑driven hemodynamic response in the CGRP group may reflect modulation of late‑phase vasodilatory dynamics, variability in vasomotor reserve, or other unmeasured physiological or behavioral factors.34,35 Whether this pattern represents attenuation of excessive vasoreactivity or a relative reduction in cerebrovascular reserve remains uncertain and warrants confirmation in larger, mechanistically oriented studies. Accordingly, the present findings should be interpreted primarily in terms of longitudinal change patterns rather than absolute CVR values at individual time points.
From a clinical perspective, these findings imply that improvement in migraine burden may not necessarily require concurrent normalization of CVR. Nociceptive network modulation and cerebrovascular autoregulatory adaptation may therefore represent partially independent physiological domains. Accordingly, fNIRS-based cerebrovascular indices should be interpreted as complementary rather than surrogate markers of treatment response, particularly within short term therapeutic windows.36-38
One plausible interpretation is that CGRP monoclonal antibody therapy primarily exerts therapeutic benefit through modulation of trigeminovascular nociceptive signaling rather than direct correction of cerebrovascular autoregulatory dysfunction.1 CGRP blockade may effectively suppress migraine attacks without immediately normalizing interictal neurovascular abnormalities. Alternatively, cerebrovascular adaptations may require longer treatment duration or cumulative exposure before measurable changes in vasomotor responsiveness emerge. This interpretation aligns with prior reports indicating that vascular and perfusion abnormalities may persist interictally despite clinical improvement.13,39
It is also possible that distinct migraine phenotypes exist some characterized predominantly by nociceptive network dysregulation and others by greater cerebrovascular dysautoregulation. Future studies incorporating subgroup- or responder-stratified analyses, extended longitudinal observation, and multimodal vascular assessment will be required to clarify these relationships and determine whether CVR trajectories carry prognostic or mechanistic relevance in migraine.16
From a methodological standpoint, the BHT was used as a practical hypercapnic challenge for fNIRS-based assessment of cerebrovascular reactivity. Although controlled CO2 inhalation offers a more standardized stimulus, it requires specialized equipment and monitoring, which limits feasibility for routine or longitudinal studies. By contrast, the BHT induces hypercapnia with minimal procedural burden and allows repeated assessments. Prior reports showing good correspondence between BH derived and CO2-based CVR measures support its suitability as a pragmatic approach for longitudinal evaluation, despite inter-individual variability in BH capacity.6,25,40
In the present study, fNIRS measurements were confined to the prefrontal cortex. Although this region is not traditionally regarded as a primary nociceptive hub, it plays an important role in autonomic regulation and cognitive-affective integration of pain, and it has demonstrated robust CVR to hypercapnic challenge in prior fNIRS studies.41 Therefore, the present measurements likely capture a meaningful component of cortical vascular regulation relevant to migraine pathophysiology, although additional cortical and subcortical regions may contribute to cerebrovascular adaptation in ways not captured in our dataset.4
Several limitations should be acknowledged. Episodic and chronic migraine patients were analyzed together without stratification by migraine subtype. Given the known differences in disease severity between these subtypes, this heterogeneity may have influenced the observed treatment-related changes. Because treatment allocation was not randomized, potential confounding by indication cannot be excluded. The relatively small sample size may have limited statistical power to detect subtle between-group differences in cerebrovascular responses. The recording montage was restricted to the prefrontal cortex and may not reflect hemodynamic changes in deeper or posterior brain regions. Finally, the 3-month follow-up period may be insufficient to capture delayed or progressive cerebrovascular adaptations; given that vascular remodeling and tone regulation may occur on longer temporal scales than symptomatic improvement, extended longitudinal observation will be essential in future work. Studies incorporating larger cohorts, longer treatment exposure, expanded cortical coverage, and multimodal vascular assessment will be necessary to further elucidate the temporal relationship between clinical improvement and CVR in migraine.
AVAILABILITY OF DATA AND MATERIAL
The data presented in this study are available upon reasonable request from the corresponding author.
AUTHOR CONTRIBUTIONS
Conceptualization: DAY, YHK; Data curation: DAY, YHK; Formal analysis: JKC, YHK; Investigation: DAY, YHK; Methodology: YHK; Project administration: YHK; Supervision: YHK; Validation: JKC, YHK; Writing–original draft: DAY, YHK; Writing–review & editing: JKC, YHK.
CONFLICT OF INTEREST
No potential conflict of interest relevant to this article was reported.
FUNDING STATEMENT
This work was supported by the Korean Headache Society Research Grant (2022).
ACKNOWLEDGMENTS
Not applicable.
SUPPLEMENTARY MATERIAL
Supplementary materials are available from https://doi.org/10.62087/hpr.2025.0029.
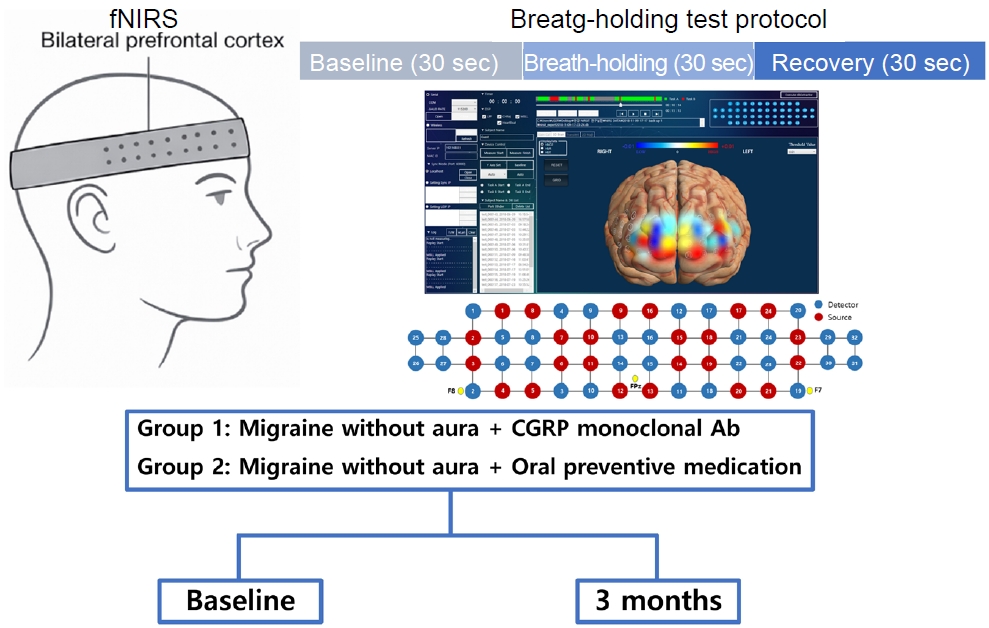
Figure 1.
Experimental setup and breath-holding test protocol for fNIRS-based cerebrovascular reactivity assessment. fNIRS was applied over the bilateral prefrontal cortex to continuously measure oxygenated and total hemoglobin concentrations. The breath-holding test involved a 30-second baseline resting phase, followed by a 30-second breath-holding phase to induce hypercapnia, and a 30-second recovery phase. All participants underwent the same protocol at baseline and at 3 months.
fNIRS, functional near-infrared spectroscopy; CGRP, calcitonin gene-related peptide; Ab, antibody; Fpz, frontal pole, midline position; F7, left frontotemporal electrode; F8, right frontotemporal electrode.

Figure 2.
Conceptual schematic of fNIRS hemodynamic response patterns during resting, breath-holding, and recovery phases. This figure provides a conceptual illustration of typical hemodynamic response patterns measured by fNIRS during resting, breath-holding, and recovery phases. The schematic illustrates overall temporal trends and directional changes rather than quantitative study data used for statistical inference.
fNIRS, functional near-infrared spectroscopy; HbO, oxygenated hemoglobin; HbR, deoxygenated hemoglobin; HbT, total hemoglobin; Hb, hemoglobin.
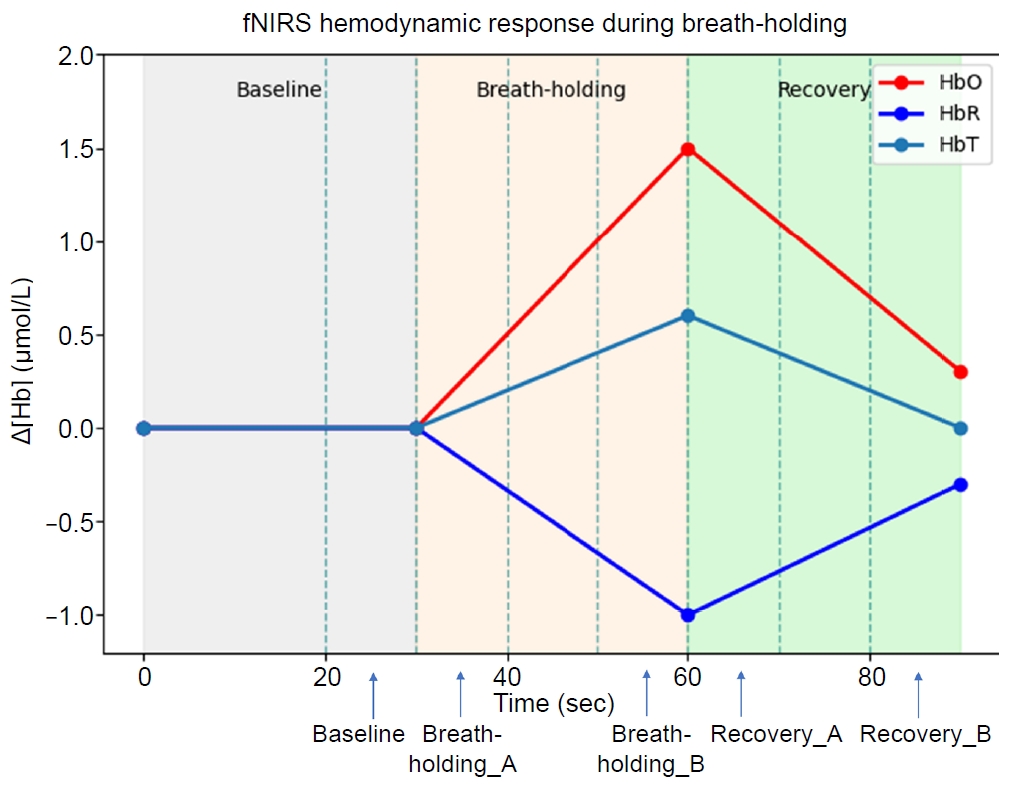
Figure 3.
(A) HbO time series during the breath-holding test across prefrontal channels in the CGRP and oral preventive groups at baseline and at 3 months. Solid lines indicate baseline recordings, and dashed lines indicate 3-month follow-up recordings. (B, C) Three-dimensional maps showing the mean HbO concentration at 3 months in (B) the CGRP monoclonal antibody group and (C) the oral preventive medication group.
CGRP, calcitonin gene-related peptide; mAb, monoclonal antibody; HbO, oxygenated hemoglobin.

Figure 4.
Treatment×time effects on the HbO-based breath-holding index on Channel 6. Tukey-adjusted p-values control the FWE rate for a family of four comparisons. Bonferroni-adjusted p-values control the FWE rate for a family of six comparisons. Green dotted line: decreasing within subject change from Base to 3M; orange dotted line: increasing within subject change from Base to 3M. Asterisk indicates a statistically significant (*p<0.05; ***p<0.001).
CGRP, calcitonin gene-related peptide; Base, baseline; 3M, 3 months; IQR, interquartile range; HbO, oxygenated hemoglobin; SE, standard error; df, degrees of freedom; FWE, family-wise error.
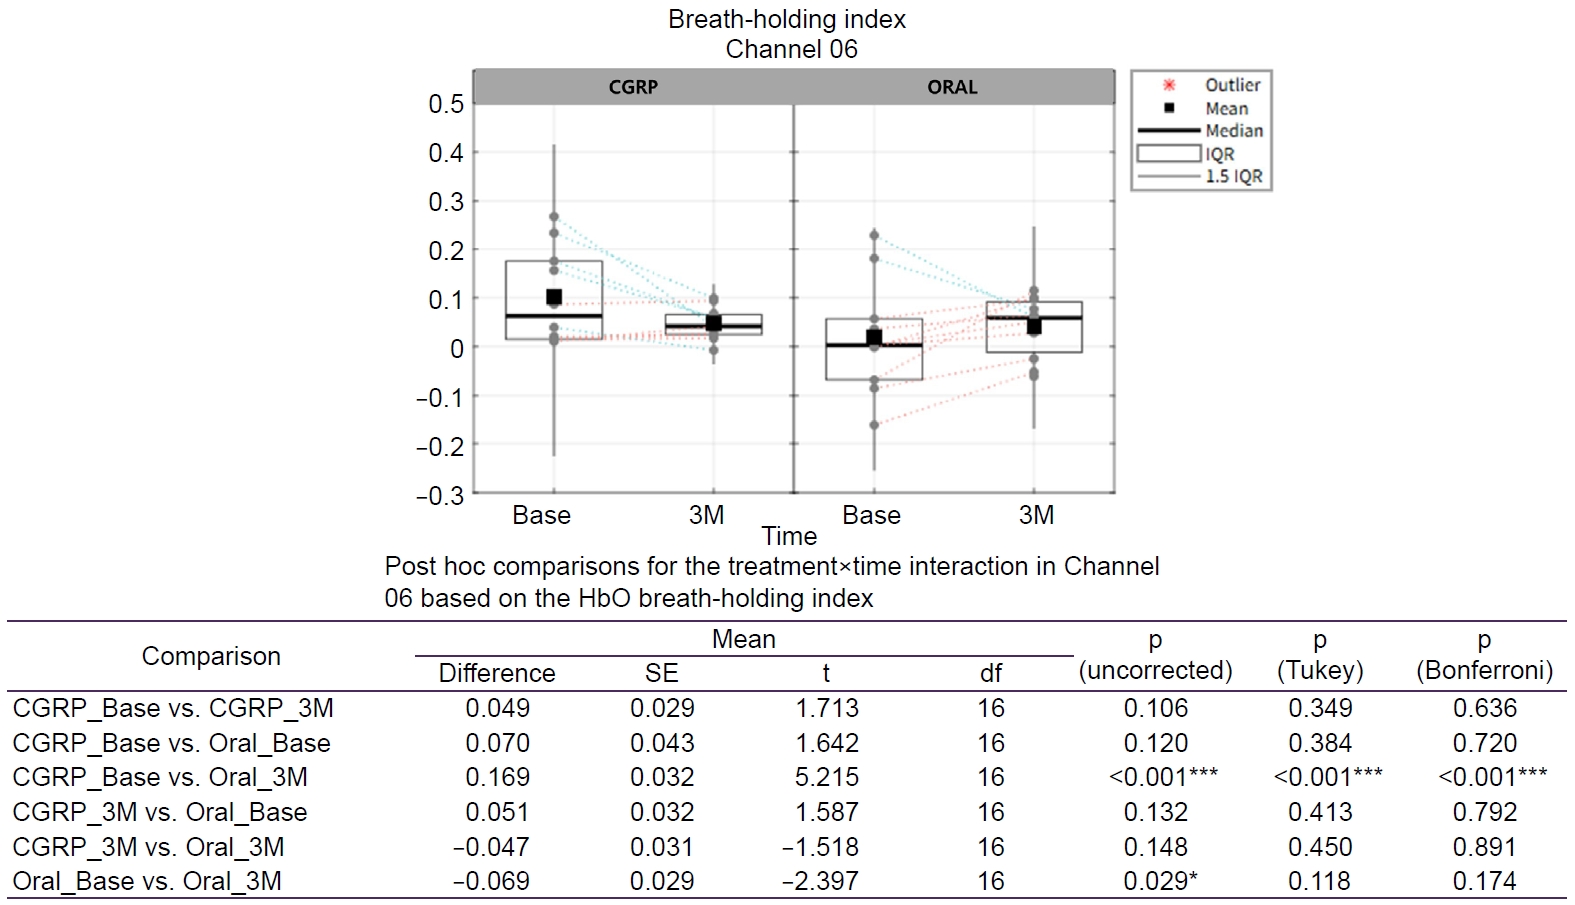
Figure 5.
Treatment×time effects on the HbO-based recovery index on Channel 10. Tukey-adjusted p-values control the FWE rate for a family of four comparisons. Bonferroni-adjusted p-values control the FWE rate for a family of six comparisons. Green dotted line: decreasing within subject change from Base to 3M; orange dotted line: increasing within subject change from Base to 3M. Asterisk indicates a statistically significant (*p<0.05; **p<0.01).
CGRP, calcitonin gene-related peptide; Base, baseline; 3M, 3 months; IQR, interquartile range; HbO, oxygenated hemoglobin; SE, standard error; df, degrees of freedom; FWE, family-wise error.

Table 1.Baseline demographic characteristics of the CGRP mAb group and oral preventive medication group
|
Variable |
G1 (CGRP mAb) |
G2 (oral) |
p-value |
|
Age (yr) |
37.92±10.53 |
45.92±12.73 |
0.11 |
|
Sex (M/F) |
1/11 |
2/10 |
>0.99 |
|
Height (cm) |
159.42±6.76 |
162.64±9.35 |
0.35 |
|
Weight (kg) |
59.79±14.78 |
66.82±19.41 |
0.34 |
|
BMI (kg/m2) |
23.47±5.24 |
25.14±6.31 |
0.50 |
Table 2.Changes in clinical outcomes from baseline to 3M in both treatment groups
|
Outcome |
G1 |
G2 |
p-value (between Δ) |
|
Base |
3M |
Δ G1 |
p-value |
Base |
3M |
Δ G2 |
p-value |
|
Headache days |
10.58 |
8.58 |
2.00 |
0.26 |
9.58 |
8.08 |
1.50 |
0.48 |
0.85 |
|
Medication days |
11.67 |
4.67 |
7.00 |
0.03*
|
9.25 |
5.75 |
3.50 |
0.19 |
0.36 |
|
HIT-6 |
60.83 |
58.50 |
2.33 |
0.44 |
63.58 |
59.08 |
4.50 |
0.05 |
0.55 |
|
MIDAS |
38.83 |
17.58 |
21.25 |
0.02*
|
31.92 |
17.58 |
14.33 |
0.11 |
0.55 |
|
GAD-7 |
2.75 |
2.92 |
–0.17 |
0.92 |
6.42 |
5.33 |
1.08 |
0.29 |
0.50 |
|
PHQ-9 |
5.25 |
5.42 |
–0.17 |
0.94 |
9.42 |
8.00 |
1.42 |
0.14 |
0.49 |
|
PGIC (3M) |
- |
4.50 |
- |
- |
- |
3.42 |
- |
- |
0.15 |
Table 3.Two-way ANOVA results for the HbO-based breath-holding index
|
Channel |
F-value |
df1 |
df2 |
p-value |
p-value (FWE) |
p-value (FDR) |
|
01 |
1.880 |
1 |
20 |
0.186 |
>0.99 |
0.774 |
|
02 |
1.416 |
1 |
15 |
0.252 |
>0.99 |
0.774 |
|
03 |
1.874 |
1 |
14 |
0.193 |
>0.99 |
0.774 |
|
04 |
0.103 |
1 |
18 |
0.752 |
>0.99 |
0.908 |
|
05 |
0.167 |
1 |
18 |
0.687 |
>0.99 |
0.908 |
|
06 |
8.448 |
1 |
16 |
0.010*
|
0.155 |
0.155 |
|
07 |
0.475 |
1 |
19 |
0.499 |
>0.99 |
0.908 |
|
08 |
0.010 |
1 |
14 |
0.924 |
>0.99 |
0.924 |
|
09 |
0.028 |
1 |
19 |
0.869 |
>0.99 |
0.924 |
|
10 |
0.873 |
1 |
20 |
0.361 |
>0.99 |
0.774 |
|
11 |
0.075 |
1 |
20 |
0.787 |
>0.99 |
0.908 |
|
12 |
1.197 |
1 |
18 |
0.288 |
>0.99 |
0.774 |
|
13 |
0.316 |
1 |
16 |
0.582 |
>0.99 |
0.908 |
|
14 |
0.890 |
1 |
18 |
0.358 |
>0.99 |
0.774 |
|
15 |
0.081 |
1 |
13 |
0.781 |
>0.99 |
0.908 |
Table 4.Two-way ANOVA results for the HbO-based recovery index
|
Channel |
F-value |
df1 |
df2 |
p-value |
p-value (FWE) |
p-value (FDR) |
|
01 |
1.219 |
1 |
17 |
0.285 |
>0.99 |
0.512 |
|
02 |
0.004 |
1 |
15 |
0.948 |
>0.99 |
0.948 |
|
03 |
2.378 |
1 |
16 |
0.143 |
>0.99 |
0.478 |
|
04 |
0.555 |
1 |
19 |
0.466 |
>0.99 |
0.635 |
|
05 |
0.949 |
1 |
20 |
0.342 |
>0.99 |
0.512 |
|
06 |
2.604 |
1 |
19 |
0.123 |
>0.99 |
0.478 |
|
07 |
2.355 |
1 |
22 |
0.139 |
>0.99 |
0.478 |
|
08 |
0.346 |
1 |
16 |
0.565 |
>0.99 |
0.706 |
|
09 |
2.165 |
1 |
17 |
0.159 |
>0.99 |
0.478 |
|
10 |
8.242 |
1 |
20 |
0.009*
|
0.142 |
0.142 |
|
11 |
0.241 |
1 |
21 |
0.629 |
>0.99 |
0.725 |
|
12 |
1.148 |
1 |
17 |
0.299 |
>0.99 |
0.512 |
|
13 |
1.412 |
1 |
18 |
0.250 |
>0.99 |
0.512 |
|
14 |
0.173 |
1 |
17 |
0.683 |
>0.99 |
0.732 |
|
15 |
0.974 |
1 |
13 |
0.342 |
>0.99 |
0.512 |
REFERENCES
- 1. Goadsby PJ, Holland PR, Martins-Oliveira M, Hoffmann J, Schankin C, Akerman S. Pathophysiology of migraine: a disorder of sensory processing. Physiol Rev 2017;97:553-622.ArticlePubMedPMC
- 2. Ashina M, Hansen JM, Do TP, Melo-Carrillo A, Burstein R, Moskowitz MA. Migraine and the trigeminovascular system-40 years and counting. Lancet Neurol 2019;18:795-804.ArticlePubMedPMC
- 3. Dodick DW. A phase-by-phase review of migraine pathophysiology. Headache 2018;58 Suppl 1:4-16.ArticlePubMedPDF
- 4. Akin A, Bilensoy D. Cerebrovascular reactivity to hypercapnia in migraine patients measured with near-infrared spectroscopy. Brain Res 2006;1107:206-214.ArticlePubMed
- 5. Kastrup A, Krüger G, Neumann-Haefelin T, Moseley ME. Assessment of cerebrovascular reactivity with functional magnetic resonance imaging: comparison of CO(2) and breath holding. Magn Reson Imaging 2001;19:13-20.ArticlePubMed
- 6. Tancredi FB, Hoge RD. Comparison of cerebral vascular reactivity measures obtained using breath-holding and CO2 inhalation. J Cereb Blood Flow Metab 2013;33:1066-1074.ArticlePubMedPMCPDF
- 7. Cho SJ. Toward precision migraine care: genetics, symptoms, and big-data-driven approaches. Headache Pain Res 2025;26:171-172.ArticlePDF
- 8. Wattiez AS, Sowers LP, Russo AF. Calcitonin gene-related peptide (CGRP): role in migraine pathophysiology and therapeutic targeting. Expert Opin Ther Targets 2020;24:91-100.ArticlePubMedPMC
- 9. Iyengar S, Johnson KW, Ossipov MH, Aurora SK. CGRP and the trigeminal system in migraine. Headache 2019;59:659-681.ArticlePubMedPMCPDF
- 10. Eun MY, Jung JM, Choi JC. A practical approach to headache in Moyamoya disease. Headache Pain Res 2025;26:173-183.ArticlePDF
- 11. Silberstein SD, Dodick DW, Bigal ME, et al. Fremanezumab for the preventive treatment of chronic migraine. N Engl J Med 2017;377:2113-2122.ArticlePubMedPMC
- 12. Dodick DW, Silberstein SD, Bigal ME, et al. Effect of fremanezumab compared with placebo for prevention of episodic migraine: a randomized clinical trial. JAMA 2018;319:1999-2008.ArticlePubMedPMC
- 13. Carter SC, Cucchiara B, Reehal N, Hamilton K, Kaiser EA, Favilla CG. Effect of CGRP inhibitors on interictal cerebral hemodynamics in individuals with migraine. Front Neurol 2024;15:1399792.ArticlePubMedPMC
- 14. Willie CK, Tzeng YC, Fisher JA, Ainslie PN. Integrative regulation of human brain blood flow. J Physiol 2014;592:841-859.ArticlePubMedPMC
- 15. Battisti-Charbonney A, Fisher J, Duffin J. The cerebrovascular response to carbon dioxide in humans. J Physiol 2011;589:3039-3048.ArticlePubMedPMC
- 16. Dzator JS, Howe PR, Wong RH. Profiling cerebrovascular function in migraine: a systematic review and meta-analysis. J Cereb Blood Flow Metab 2021;41:919-944.ArticlePubMedPMCPDF
- 17. Silvestrini M, Vernieri F, Pasqualetti P, et al. Impaired cerebral vasoreactivity and risk of stroke in patients with asymptomatic carotid artery stenosis. JAMA 2000;283:2122-2127.ArticlePubMed
- 18. Afridi SK, Giffin NJ, Kaube H, et al. A positron emission tomographic study in spontaneous migraine. Arch Neurol 2005;62:1270-1275.ArticlePubMedPMC
- 19. Cao Y, Aurora SK, Nagesh V, Patel SC, Welch KM. Functional MRI-BOLD of brainstem structures during visually triggered migraine. Neurology 2002;59:72-78.ArticlePubMed
- 20. Zhao YN, Han PP, Zhang XY, Bi X. Applications of functional near-infrared spectroscopy (fNIRS) neuroimaging during rehabilitation following stroke: a review. Med Sci Monit 2024;30:e943785.ArticlePubMedPMC
- 21. Kim YH, Paik SH, Kim Y, et al. Clinical application of functional near-infrared spectroscopy for burn assessment. Front Bioeng Biotechnol 2023;11:1127563.ArticlePubMedPMC
- 22. Kim YH, Kim Y, Yoon J, et al. Frontal lobe hemodynamics detected by functional near-infrared spectroscopy during head-up tilt table tests in patients with electrical burns. Front Hum Neurosci 2022;16:986230.ArticlePubMedPMC
- 23. Kim YH, Phillips VZ, Paik SH, Jeon NJ, Kim BM, Kim BJ. Prefrontal hemodynamic changes measured using near-infrared spectroscopy during the Valsalva maneuver in patients with orthostatic intolerance. Neurophotonics 2018;5:015002.ArticlePubMedPMC
- 24. Kim YH, Paik SH, Phillips VZ, Jeon NJ, Kim BJ, Kim BM. Cerebral perfusion monitoring using near-infrared spectroscopy during head-up tilt table test in patients with orthostatic intolerance. Front Hum Neurosci 2019;13:55.ArticlePubMedPMC
- 25. Chan ST, Evans KC, Song TY, et al. Cerebrovascular reactivity assessment with O2-CO2 exchange ratio under brief breath hold challenge. PLoS One 2020;15:e0225915.ArticlePubMedPMC
- 26. Karunakaran KD, Ji K, Chen DY, et al. Relationship between age and cerebral hemodynamic response to breath holding: a functional near-infrared spectroscopy study. Brain Topogr 2021;34:154-166.ArticlePubMedPDF
- 27. Kosinski M, Bayliss MS, Bjorner JB, et al. A six-item short-form survey for measuring headache impact: the HIT-6. Qual Life Res 2003;12:963-974.ArticlePubMedPMCPDF
- 28. Stewart WF, Lipton RB, Dowson AJ, Sawyer J. Development and testing of the Migraine Disability Assessment (MIDAS) Questionnaire to assess headache-related disability. Neurology 2001;56:S20-S28.ArticlePubMed
- 29. Spitzer RL, Kroenke K, Williams JB, Löwe B. A brief measure for assessing generalized anxiety disorder: the GAD-7. Arch Intern Med 2006;166:1092-1097.ArticlePubMedPMC
- 30. Kroenke K, Spitzer RL, Williams JB. The PHQ-9: validity of a brief depression severity measure. J Gen Intern Med 2001;16:606-613.ArticlePubMedPMC
- 31. Hurst H, Bolton J. Assessing the clinical significance of change scores recorded on subjective outcome measures. J Manipulative Physiol Ther 2004;27:26-35.ArticlePubMed
- 32. Molinari F, Liboni W, Grippi G, Negri E. Relationship between oxygen supply and cerebral blood flow assessed by transcranial Doppler and near-infrared spectroscopy in healthy subjects during breath-holding. J Neuroeng Rehabil 2006;3:16.ArticlePubMedPMCPDF
- 33. Altamura C, Viticchi G, Fallacara A, et al. Erenumab does not alter cerebral hemodynamics and endothelial function in migraine without aura. Cephalalgia 2021;41:90-98.ArticlePubMedPDF
- 34. Russo A, Silvestro M, Scotto di Clemente F, et al. Multidimensional assessment of the effects of erenumab in chronic migraine patients with previous unsuccessful preventive treatments: a comprehensive real-world experience. J Headache Pain 2020;21:69.ArticlePubMedPMCPDF
- 35. Ayata C, Lauritzen M. Spreading depression, spreading depolarizations, and the cerebral vasculature. Physiol Rev 2015;95:953-993.ArticlePubMedPMC
- 36. Ferrari MD, Goadsby PJ, Burstein R, et al. Migraine. Nat Rev Dis Primers 2022;8:2.ArticlePubMedPDF
- 37. Akin A, Bilensoy D, Emir UE, Gülsoy M, Candansayar S, Bolay H. Cerebrovascular dynamics in patients with migraine: near-infrared spectroscopy study. Neurosci Lett 2006;400:86-91.ArticlePubMed
- 38. Vitt JR, Loper NE, Mainali S. Multimodal and autoregulation monitoring in the neurointensive care unit. Front Neurol 2023;14:1155986.ArticlePubMedPMC
- 39. Bsteh G, Marik W, Krajnc N, et al. MRI features of idiopathic intracranial hypertension are not prognostic of visual and headache outcome. J Headache Pain 2023;24:97.ArticlePubMedPMCPDF
- 40. Pinto J, Bright MG, Bulte DP, Figueiredo P. Cerebrovascular reactivity mapping without gas challenges: a methodological guide. Front Physiol 2021;11:608475.ArticlePubMedPMC
- 41. Du J, Shi P, Fang F, Yu H. Cerebral cortical hemodynamic metrics to aid in assessing pain levels? A pilot study of functional near-infrared spectroscopy. Front Neurosci 2023;17:1136820.ArticlePubMedPMC
Citations
Citations to this article as recorded by


 , Jong Kwan Choi2
 PubReader
 ePub Link
 Cite this Article