
Articles
- Page Path
- HOME > Headache Pain Res > Volume 27(1); 2026 > Article
-
Original Article
Natural Diagnostic Classes of Headache Disorders: Latent Class Analysis of a Population-Based Study -
Wonwoo Lee1
 , Seok-Jae Heo2, Jungyon Yum1, Min Kyung Chu3
 -
Headache and Pain Research 2026;27(1):30-42.
DOI: https://doi.org/10.62087/hpr.2026.0004
Published online: February 26, 2026
1Department of Neurology, Yongin Severance Hospital, Yonsei University College of Medicine, Yongin, Republic of Korea
2Biostatistics Collaboration Unit, Department of Biomedical Systems Informatics, Yonsei University College of Medicine, Seoul, Republic of Korea
3Department of Neurology, Severance Hospital, Yonsei University College of Medicine, Seoul, Republic of Korea
- Correspondence: Min Kyung Chu, M.D., Ph.D. Department of Neurology, Severance Hospital, Yonsei University College of Medicine, 50-1 Yonsei-ro, Seodaemun-gu, Seoul 03722, Republic of Korea Tel: +82-2-2228-1600, Fax: +82-2-393-0705, E-mail: chumk@yonsei.ac.kr
© 2026 The Korean Headache Society
This is an Open Access article distributed under the terms of the Creative Commons Attribution Non-Commercial License (https://creativecommons.org/licenses/by-nc/4.0) which permits unrestricted non-commercial use, distribution, and reproduction in any medium, provided the original work is properly cited.
- 1,160 Views
- 17 Download
Abstract
-
Purpose
- The International Classification of Headache Disorders, 3rd edition (ICHD-3), diagnoses headache based on combinations of clinical symptoms. Overlap is common, and symptom variability complicates diagnosis. We evaluated natural classes of headache disorders using a statistical approach and compared them with ICHD-3 diagnostic categories.
-
Methods
- Data from a nationwide, population-based web survey on headache and sleep conducted in South Korea (n=3,030) were analyzed. Participants with headache (n=1,938) were included. Latent class analysis was performed using categorical ICHD-3 diagnostic criteria to identify distinct classes. The characteristics of each class and the distribution of ICHD-3 primary headache diagnoses were examined.
-
Results
- Nine classes were identified, comprising 626, 54, 248, 148, 187, 143, 79, 61, and 392 individuals. Three classes were tension-type headache (TTH)–like: Class 1 was male-dominant mild bilateral TTH, Class 8 represented classic, severe TTH, and Class 9 was mild unilateral TTH. Class 4 showed a typical migraine phenotype and contained most migraine cases. Classes 5 and 6 were dominated by probable migraine (PM) and differed mainly in sensory sensitivity and disability, which were higher in Class 6. Classes 2, 3, and 7 were categorized as “other headache.” Class 2 had the highest prevalence of medication-overuse headache (MOH), whereas Class 3 was characterized by mild headache with nausea. Class 7 showed a mixed-type profile with prominent photophobia. Severity and central sensitization markers were key classifiers.
-
Conclusion
- Latent class analysis identified nine clinically distinct headache classes. PM was clearly distinct from both TTH and migraine. One subtype of “other headache” showed the highest MOH burden.
INTRODUCTION
MATERIALS AND METHODS
RESULTS
DISCUSSION
AVAILABILITY OF DATA AND MATERIAL
The data presented in this study are available upon reasonable request from the corresponding author.
AUTHOR CONTRIBUTIONS
Conceptualization: WL, MKC; Data curation: WL, SJH, JY, MKC; Formal analysis: WL, SJH, MKC; Investigation: WL, JY, MKC; Methodology: WL, SJH; Writing–original draft: WL, SJH; Writing–review & editing: WL, SJH, JY, MKC.
CONFLICT OF INTEREST
Seok-Jae Heo and Jungyon Yum declare no conflicts of interest. Wonwoo Lee was involved as a site investigator in a multicenter trial sponsored by Eli Lilly and Co., WhanIn Pharm Co. Ltd., and Handok-Teva. He has received lecture honoraria from Abbott and SK chemical in the past 24 months. Min Kyung Chu was a site investigator for a multicenter trial sponsored by Allergan Korea, Biohaven Pharmaceuticals, and Lundbeck Korea. He has received lecture honoraria from Allergan Korea, Handok-Teva, Eli Lilly and Company, and Yuyu Pharmaceutical Company in the past 24 months. Additionally, he received grants from Yonsei University College of Medicine (6-2021-0229), the Korea Health Industry Development Institute (KHIDI) (HV22C0106), and National Research Foundation of Korea (2022R1A2C1091767).
FUNDING STATEMENT
This study was supported by a 2023 research grant for the headache research group, from the Headache Research Committee of the Korean Headache Society.
ACKNOWLEDGMENTS
Grammatical revisions were supported by ChatGPT (versions 4o–5.2).
SUPPLEMENTARY MATERIAL
Supplementary Table 1.
Supplementary Table 2.
Supplementary Table 3.

Values are presented as number (%). Pairwise comparisons with Bonferroni correction are provided in the supplementary tables (Supplementary Table 2, available online).
ICHD-3, International Classification of Headache Disorders, 3rd edition.
Values are presented as number (%) or median (interquartile range). Pairwise comparisons with Bonferroni correction are provided in the supplementary tables (Supplementary Table 3, available online).
VARS, Visual Aura Rating Scale; HIT-6, Headache Impact Test-6; MIDAS, Migraine Disability Assessment; GAD-7, Generalized Anxiety Disorder-7; PHQ-9, Patient Health Questionnaire-9; ASC-12, Allodynia Symptom Checklist-12; FSS, Fatigue Severity Scale; ESS, Epworth Sleepiness Scale; PSQI, Pittsburgh Sleep Quality Index; ISI, Insomnia Severity Index; ICHD-3, International Classification of Headache Disorders, 3rd edition.
- 1. Headache Classification Committee of the International Headache Society (IHS). The International Classification of Headache Disorders, 3rd edition. Cephalalgia 2018;38:1-211.ArticlePubMedPMCPDF
- 2. Lee W, Heo SJ, Chu MK. Natural subgroups of tension-type headache: a population-based study. Headache 2025;65:1160-1169.ArticlePubMed
- 3. Lee W, Min IK, Yang KI, Kim D, Yun CH, Chu MK. Classifying migraine subtypes and their characteristics by latent class analysis using data of a nation-wide population-based study. Sci Rep 2021;11:21595.ArticlePubMedPMCPDF
- 4. Lipton RB, Fanning KM, Buse DC, et al. Identifying natural subgroups of migraine based on comorbidity and concomitant condition profiles: results of the Chronic Migraine Epidemiology and Outcomes (CaMEO) study. Headache 2018;58:933-947.ArticlePubMedPDF
- 5. Zhang P. Which headache disorders can be diagnosed concurrently? An analysis of ICHD3 criteria using prime encoding system. Front Neurol 2023;14:1221209.ArticlePubMedPMC
- 6. Chang Y, Choi S, Kim BS, Song TJ. Validity of migraine diagnoses in Korean National Health Insurance Claims data. Headache Pain Res 2025;26:154-161.ArticlePDF
- 7. Lee W, Chu MK. The current role of artificial intelligence in the field of headache disorders, with a focus on migraine: a systemic review. Headache Pain Res 2025;26:48-65.ArticlePDF
- 8. Kim BK, Chung YK, Kim JM, Lee KS, Chu MK. Prevalence, clinical characteristics and disability of migraine and probable migraine: a nationwide population-based survey in Korea. Cephalalgia 2013;33:1106-1116.ArticlePubMedPMCPDF
- 9. Sinha P, Calfee CS, Delucchi KL. Practitioner’s guide to latent class analysis: methodological considerations and common pitfalls. Crit Care Med 2021;49:e63-e79.ArticlePubMedPMC
- 10. Lee W, Cho SJ, Hwang H, et al. Crystal-clear days and unclear days in migraine: a population-based study. Headache 2022;62:818-827.ArticlePubMedPDF
- 11. Korean Statistical Information Service. Statistical database: population, households and housing unit [Internet]. Statistics Korea; 2018 [cited 2026 Jan 13]. Available from: https://kosis.kr/eng/statisticsList/statisticsListIndex.do?menuId=M_01_01&vwcd=MT_ETITLE&parmTabId=M_01_01&statId=1962001&themaId=#SelectStatsBoxDiv
- 12. Kim KM, Kim AR, Lee W, Jang BH, Heo K, Chu MK. Development and validation of a web-based headache diagnosis questionnaire. Sci Rep 2022;12:7032.ArticlePubMedPMCPDF
- 13. Kosinski M, Bayliss MS, Bjorner JB, et al. A six-item short-form survey for measuring headache impact: the HIT-6. Qual Life Res 2003;12:963-974.ArticlePubMedPMCPDF
- 14. Stewart WF, Lipton RB, Kolodner KB, Sawyer J, Lee C, Liberman JN. Validity of the Migraine Disability Assessment (MIDAS) score in comparison to a diary-based measure in a population sample of migraine sufferers. Pain 2000;88:41-52.ArticlePubMed
- 15. Han SM, Kim KM, Cho SJ, et al. Prevalence and characteristics of cutaneous allodynia in probable migraine. Sci Rep 2021;11:2467.ArticlePubMedPMCPDF
- 16. Seo JG, Park SP. Validation of the Generalized Anxiety Disorder-7 (GAD-7) and GAD-2 in patients with migraine. J Headache Pain 2015;16:97.ArticlePubMedPMCPDF
- 17. Kim M, Jung S, Park JE, et al. Validation of the Patient Health Questionnaire-9 and Patient Health Questionnaire-2 in the general Korean population. Psychiatry Investig 2023;20:853-860.ArticlePubMedPMCPDF
- 18. Wolfe F, Clauw DJ, Fitzcharles MA, et al. 2016 Revisions to the 2010/2011 fibromyalgia diagnostic criteria. Semin Arthritis Rheum 2016;46:319-329.ArticlePubMedPMC
- 19. Cho YW, Lee JH, Son HK, Lee SH, Shin C, Johns MW. The reliability and validity of the Korean version of the Epworth sleepiness scale. Sleep Breath 2011;15:377-384.ArticlePubMedPDF
- 20. Sohn SI, Kim DH, Lee MY, Cho YW. The reliability and validity of the Korean version of the Pittsburgh Sleep Quality Index. Sleep Breath 2012;16:803-812.ArticlePubMedPDF
- 21. Cho YW, Song ML, Morin CM. Validation of a Korean version of the insomnia severity index. J Clin Neurol 2014;10:210-215.Article
- 22. Linzer DA, Lewis JB. poLCA: an R Package for polytomous variable latent class analysis. J Stat Softw 2011;42:1-29.Article
- 23. Dean N, Raftery AE. Latent class analysis variable selection. Ann Inst Stat Math 2010;62:11-35.ArticlePubMedPMCPDF
- 24. Wurpts IC, Geiser C. Is adding more indicators to a latent class analysis beneficial or detrimental? Results of a Monte-Carlo study. Front Psychol 2014;5:920.ArticlePubMedPMC
- 25. Kim KM, Cho SJ, Shin HJ, et al. Prevalence, disability, and management patterns of migraine in Korea: nationwide survey data from 2009 and 2018. J Clin Neurol 2021;17:77-85.ArticlePubMedPMCPDF
- 26. Viana M, Khaliq F, Zecca C, et al. Poor patient awareness and frequent misdiagnosis of migraine: findings from a large transcontinental cohort. Eur J Neurol 2020;27:536-541.ArticlePubMedPDF
- 27. Kristoffersen ES, Faiz KW, Hansen JM, et al. The management and clinical knowledge of headache disorders among general practitioners in Norway: a questionnaire survey. J Headache Pain 2021;22:136.ArticlePubMedPMCPDF
- 28. Onan D, Younis S, Wellsgatnik WD, et al. Debate: differences and similarities between tension-type headache and migraine. J Headache Pain 2023;24:92.ArticlePubMedPMCPDF
- 29. Baha M, Nachit-Ouinekh F, El Hasnaoui A. Intrapatient variability of migraine attacks: stability analysis of the MIGSEV scale. Headache 2008;48:79-85.ArticlePubMed
- 30. Vandenbussche N, Van Der Donckt J, De Brouwer M, et al. Tracking migraine symptoms: a longitudinal comparison of smartphone-based headache diaries and clinical interviews. Neurol Int 2025;17:33.ArticlePubMedPMC
- 31. Lipton RB, Bigal ME, Diamond M, et al. Migraine prevalence, disease burden, and the need for preventive therapy. Neurology 2007;68:343-349.ArticlePubMed
- 32. Silberstein S, Loder E, Diamond S, et al. Probable migraine in the United States: results of the American Migraine Prevalence and Prevention (AMPP) study. Cephalalgia 2007;27:220-229.ArticlePubMedPDF
- 33. Kim BS, Chung PW, Chung JM, Park KY, Moon HS, Park HK, et al. Evidence-based recommendations on pharmacologic treatment for migraine prevention: a clinical practice guideline from the Korean Headache Society. Headache Pain Res 2025;26:5-20.ArticlePDF
- 34. Lee HJ, Cho SJ, Seo JG, Schytz HW. Update on tension-type headache. Headache Pain Res 2025;26:38-47.ArticlePDF
- 35. Kim M, Yu JK, Kim YH. Update on cluster headaches: from genetic to novel therapeutic approaches. Headache Pain Res 2024;25:42-53.ArticlePDF
- 36. Suzuki K, Suzuki S, Shiina T, et al. Investigating the relationships between the burden of multiple sensory hypersensitivity symptoms and headache-related disability in patents with migraine. J Headache Pain 2021;22:77.ArticlePubMedPMCPDF
- 37. Schwartz BS, Stewart WF, Simon D, Lipton RB. Epidemiology of tension-type headache. JAMA 1998;279:381-383.ArticlePubMed
- 38. Fuensalida-Novo S, Jiménez-Antona C, Benito-González E, Cigarán-Méndez M, Parás-Bravo P, Fernández-De-Las-Peñas C. Current perspectives on sex differences in tension-type headache. Expert Rev Neurother 2020;20:659-666.ArticlePubMed
- 39. Ashina S, Terwindt GM, Steiner TJ, et al. Medication overuse headache. Nat Rev Dis Primers 2023;9:5.ArticlePubMedPDF
- 40. Smetana GW. The diagnostic value of historical features in primary headache syndromes: a comprehensive review. Arch Intern Med 2000;160:2729-2737.ArticlePubMed
- 41. Cousins G, Hijazze S, Van de Laar FA, Fahey T. Diagnostic accuracy of the ID Migraine: a systematic review and meta-analysis. Headache 2011;51:1140-1148.ArticlePubMed
- 42. Seo JG, Park SP. Clinical significance of sensory hypersensitivities in migraine patients: does allodynia have a priority on it? Neurol Sci 2019;40:393-398.ArticlePubMedPDF
- 43. Rasmussen BK, Olesen J. Migraine with aura and migraine without aura: an epidemiological study. Cephalalgia 1992;12:221-228.ArticlePubMedPDF
- 44. Lipton RB, Bigal ME, Ashina S, et al. Cutaneous allodynia in the migraine population. Ann Neurol 2008;63:148-158.ArticlePubMedPMC
- 45. Kalita J, Misra UK, Bansal R. Phonophobia and brainstem excitability in migraine. Eur J Neurosci 2021;53:1988-1997.ArticlePubMedPDF
- 46. Burstein R, Noseda R, Fulton AB. Neurobiology of photophobia. J Neuroophthalmol 2019;39:94-102.ArticlePubMedPMC
REFERENCES
Figure & Data
References
Citations
 PubReader
 Cite this Article
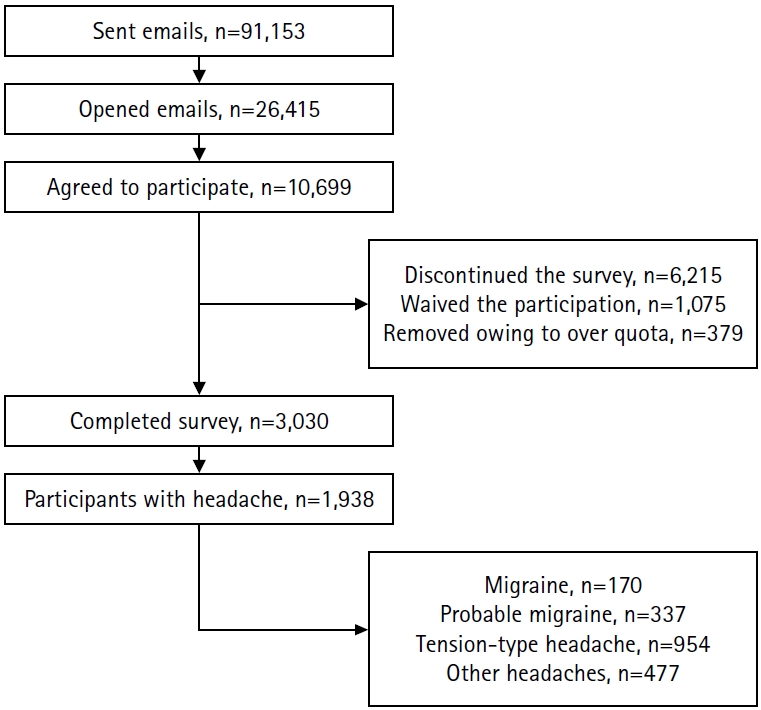

Figure 1.
| Number of classes | df | log-likelihood | AIC | BIC | Relative entropy | LMR | p-value | Size of each class |
|---|---|---|---|---|---|---|---|---|
| 2 | 1,905 | –13,415.19 | 26,896.38 | 27,080.17 | 0.867 | 1,115.581 | <0.001 | 286|1652 |
| 3 | 1,888 | –13,066.55 | 26,233.09 | 26,511.56 | 0.856 | 667.880 | <0.001 | 353|490|1095 |
| 4 | 1,871 | –12,753.56 | 25,641.12 | 26,014.27 | 0.839 | 599.565 | <0.001 | 324|483|516|615 |
| 5 | 1,854 | –12,637.72 | 25,443.44 | 25,911.27 | 0.872 | 221.913 | <0.001 | 61|365|402|491|619 |
| 6 | 1,837 | –12,519.00 | 25,240.00 | 25,802.51 | 0.893 | 227.423 | <0.001 | 60|186|194|415|464|619 |
| 7 | 1,820 | –12,435.96 | 25,107.91 | 25,765.10 | 0.905 | 159.083 | <0.001 | 60|63|169|184|394|443|625 |
| 8 | 1,803 | –12,371.25 | 25,012.51 | 25,764.38 | 0.917 | 123.946 | <0.001 | 51|60|165|171|185|286|393|627 |
| 9 | 1,786 | –12,304.99 | 24,913.98 | 25,760.53 | 0.895 | 126.934 | <0.001 | 54|61|79|143|148|187|248|392|626 |
| 10 | 1,769 | –12,296.13 | 24,930.26 | 25,871.49 | 0.888 | 16.977 | 0.456 | 41|61|86|129|142|150|163|261|396|509 |
| Characteristic | Total | Class 1 | Class 2 | Class 3 | Class 4 | Class 5 | Class 6 | Class 7 | Class 8 | Class 9 | p-value |
|---|---|---|---|---|---|---|---|---|---|---|---|
| Participant (n) | 1,938 (100) | 626 (100) | 54 (100) | 248 (100) | 148 (100) | 187 (100) | 143 (100) | 79 (100) | 61 (100) | 392 (100) | |
| Age (yr) | 40.44±10.74 | 41.78±10.89 | 38.33±9.44 | 40.85±11.22 | 39.64±9.90 | 40.08±10.53 | 39.06±10.55 | 39.62±11.00 | 37.93±10.62 | 39.86±10.60 | 0.004 |
| Sex | <0.001 | ||||||||||
| Male | 851 (43.9) | 339 (54.2) | 18 (33.3) | 125 (50.4) | 31 (20.9) | 78 (41.7) | 49 (34.3) | 39 (49.4) | 23 (37.7) | 149 (38.0) | |
| Female | 1,087 (56.1) | 287 (45.8) | 36 (66.7) | 123 (49.6) | 117 (79.1) | 109 (58.3) | 94 (65.7) | 40 (50.6) | 38 (62.3) | 243 (62.0) | |
| Education | 0.632 | ||||||||||
| Middle school or lower | 9 (0.5) | 1 (0.2) | 0 (0.0) | 1 (0.4) | 1 (0.7) | 1 (0.5) | 1 (0.7) | 0 (0.0) | 0 (0.0) | 4 (1.0) | |
| High school | 756 (39.0) | 248 (39.6) | 21 (38.9) | 94 (37.9) | 58 (39.2) | 60 (32.1) | 61 (42.7) | 25 (31.6) | 27 (44.3) | 162 (41.3) | |
| College or higher | 1,173 (60.5) | 377 (60.2) | 33 (61.1) | 153 (61.7) | 89 (60.1) | 126 (67.4) | 81 (56.6) | 54 (68.4) | 34 (55.7) | 226 (57.7) | |
| BMI (kg/m2) | 23.96±3.81 | 24.25±3.52 | 23.14±3.77 | 23.63±3.82 | 23.15±3.63 | 23.82±4.06 | 24.09±4.81 | 24.29±4.19 | 23.20±3.36 | 24.20±3.74 | <0.001 |
| Hypertension | 377 (19.5) | 129 (20.6) | 8 (14.8) | 44 (17.7) | 21 (14.2) | 37 (19.8) | 39 (27.3) | 19 (24.1) | 11 (18.0) | 69 (17.6) | 0.153 |
| Diabetes | 141 (7.3) | 48 (7.7) | 1 (1.9) | 18 (7.3) | 6 (4.1) | 16 (8.6) | 18 (12.6) | 8 (10.1) | 3 (4.9) | 23 (5.9) | 0.087 |
| Dyslipidemia | 308 (15.9) | 100 (16.0) | 7 (13.0) | 37 (14.9) | 23 (15.5) | 31 (16.6) | 26 (18.2) | 12 (15.2) | 7 (11.5) | 65 (16.6) | 0.973 |
| Characteristic | Total | Class 1 | Class 2 | Class 3 | Class 4 | Class 5 | Class 6 | Class 7 | Class 8 | Class 9 | p-value |
|---|---|---|---|---|---|---|---|---|---|---|---|
| Participant (n) | 1,938 (100) | 626 (100) | 54 (100) | 248 (100) | 148 (100) | 187 (100) | 143 (100) | 79 (100) | 61 (100) | 392 (100) | |
| Headache intensity | <0.001 | ||||||||||
| Mild | 1,067 (55.1) | 612 (97.8) | 0 (0.0) | 240 (96.8) | 0 (0.0) | 45 (24.1) | 56 (39.2) | 61 (77.2) | 0 (0.0) | 53 (13.5) | |
| Moderate | 747 (38.5) | 14 (2.2) | 54 (100.0) | 8 (3.2) | 71 (48.0) | 136 (72.7) | 86 (60.1) | 0 (0.0) | 56 (91.8) | 322 (82.1) | |
| Severe | 124 (6.4) | 0 (0.0) | 0 (0.0) | 0 (0.0) | 77 (52.0) | 6 (3.2) | 1 (0.7) | 18 (22.8) | 5 (8.2) | 17 (4.3) | |
| Unilateral location | 994 (51.3) | 329 (52.6) | 0 (0.0) | 116 (46.8) | 74 (50.0) | 117 (62.6) | 87 (60.8) | 10 (12.7) | 0 (0.0) | 261 (66.6) | <0.001 |
| Pulsating quality | 873 (45.0) | 213 (34.0) | 0 (0.0) | 99 (39.9) | 90 (60.8) | 139 (74.3) | 74 (51.7) | 18 (22.8) | 1 (1.6) | 239 (61.0) | <0.001 |
| Aggravation by routine physical activity | 623 (32.1) | 113 (18.1) | 0 (0.0) | 0 (0.0) | 127 (85.8) | 48 (25.7) | 143 (100.0) | 29 (36.7) | 0 (0.0) | 163 (41.6) | <0.001 |
| Nausea | 749 (38.6) | 1 (0.2) | 51 (94.4) | 246 (99.2) | 97 (65.5) | 171 (91.4) | 134 (93.7) | 49 (62.0) | 0 (0.0) | 0 (0.0) | <0.001 |
| Vomiting | 358 (18.5) | 0 (0.0) | 19 (35.2) | 54 (21.8) | 66 (44.6) | 110 (58.8) | 64 (44.8) | 45 (57.0) | 0 (0.0) | 0 (0.0) | <0.001 |
| Photophobia | 495 (25.5) | 78 (12.5) | 8 (14.8) | 0 (0.0) | 122 (82.4) | 45 (24.1) | 84 (58.7) | 67 (84.8) | 7 (11.5) | 84 (21.4) | <0.001 |
| Phonophobia | 860 (44.4) | 298 (47.6) | 1 (1.9) | 0 (0.0) | 138 (93.2) | 0 (0.0) | 143 (100.0) | 53 (67.1) | 26 (42.6) | 201 (51.3) | <0.001 |
| Headache frequency (day/mo) | <0.001 | ||||||||||
| <2 | 820 (42.3) | 379 (60.5) | 14 (25.9) | 126 (50.8) | 32 (21.6) | 50 (26.7) | 37 (25.9) | 48 (60.8) | 16 (26.2) | 118 (30.1) | |
| 2–7 | 947 (48.9) | 219 (35.0) | 30 (55.6) | 115 (46.4) | 87 (58.8) | 115 (61.5) | 77 (53.8) | 29 (36.7) | 35 (57.4) | 240 (61.2) | |
| 8–14 | 97 (5.0) | 14 (2.2) | 3 (5.6) | 2 (0.8) | 18 (12.2) | 11 (5.9) | 17 (11.9) | 0 (0.0) | 7 (11.5) | 25 (6.4) | |
| ≥15 | 74 (3.8) | 14 (2.2) | 7 (13.0) | 5 (2.0) | 11 (7.4) | 11 (5.9) | 12 (8.4) | 2 (2.5) | 3 (4.9) | 9 (2.3) | |
| Headache duration | <0.001 | ||||||||||
| <30 min | 1,240 (64.0) | 619 (98.9) | 0 (0.0) | 184 (74.2) | 0 (0.0) | 164 (87.7) | 143 (100.0) | 23 (29.1) | 0 (0.0) | 107 (27.3) | |
| 30 min-4 hr | 459 (23.7) | 0 (0.0) | 54 (100.0) | 64 (25.8) | 0 (0.0) | 0 (0.0) | 0 (0.0) | 56 (70.9) | 0 (0.0) | 285 (72.7) | |
| 4–72 hr | 200 (10.3) | 7 (1.1) | 0 (0.0) | 0 (0.0) | 127 (85.8) | 23 (12.3) | 0 (0.0) | 0 (0.0) | 43 (70.5) | 0 (0.0) | |
| 72 hr–7 day | 26 (1.3) | 0 (0.0) | 0 (0.0) | 0 (0.0) | 15 (10.1) | 0 (0.0) | 0 (0.0) | 0 (0.0) | 11 (18.0) | 0 (0.0) | |
| >7 day | 13 (0.7) | 0 (0.0) | 0 (0.0) | 0 (0.0) | 6 (4.1) | 0 (0.0) | 0 (0.0) | 0 (0.0) | 7 (11.5) | 0 (0.0) |
| Total | Class 1 | Class 2 | Class 3 | Class 4 | Class 5 | Class 6 | Class 7 | Class 8 | Class 9 | p-value | ||
|---|---|---|---|---|---|---|---|---|---|---|---|---|
| Participant (n) | 1,938 (100) | 626 (100) | 54 (100) | 248 (100) | 148 (100) | 187 (100) | 143 (100) | 79 (100) | 61 (100) | 392 (100) | ||
| Monthly headache frequency | 2.0 (1.0–3.0) | 1.0 (1.0–2.0) | 3.0 (1.0–7.0) | 1.0 (1.0–3.0) | 3.0 (2.0–6.0) | 2.0 (1.0–3.0) | 3.0 (1.0–6.0) | 1.0 (1.0–2.0) | 2.0 (1.0–5.0) | 2.0 (1.0–4.0) | <0.001 | |
| By category (day) | <0.001 | |||||||||||
| <2 | 820 (42.3) | 379 (60.5) | 14 (25.9) | 126 (50.8) | 32 (21.6) | 50 (26.7) | 37 (25.9) | 48 (60.8) | 16 (26.2) | 118 (30.1) | ||
| 2–7 | 947 (48.9) | 219 (35.0) | 30 (55.6) | 115 (46.4) | 87 (58.8) | 115 (61.5) | 77 (53.8) | 29 (36.7) | 35 (57.4) | 240 (61.2) | ||
| 8–14 | 97 (5.0) | 14 (2.2) | 3 (5.6) | 2 (0.8) | 18 (12.2) | 11 (5.9) | 17 (11.9) | 0 (0.0) | 7 (11.5) | 25 (6.4) | ||
| ≥15 | 74 (3.8) | 14 (2.2) | 7 (13.0) | 5 (2.0) | 11 (7.4) | 11 (5.9) | 12 (8.4) | 2 (2.5) | 3 (4.9) | 9 (2.3) | ||
| Aura (VARS score≥3) | 522 (26.9) | 138 (22.0) | 17 (31.5) | 54 (21.8) | 51 (34.5) | 49 (26.2) | 55 (38.5) | 25 (31.6) | 14 (23.0) | 119 (30.4) | <0.001 | |
| HIT-6 score | 53.0 (47.0–60.0) | 48.0 (42.0–53.0) | 56.0 (52.0–61.0) | 49.0 (44.5–55.0) | 63.0 (59.0–67.0) | 56.0 (51.0–61.0) | 59.0 (54.0–63.0) | 54.0 (49.0–60.0) | 56.0 (48.0–61.0) | 56.0 (50.0–61.0) | <0.001 | |
| MIDAS score | 4.0 (1.0–10.0) | 1.0 (0.0–5.0) | 7.0 (3.0–23.0) | 2.0 (0.0–6.0) | 13.0 (6.0–29.0) | 6.0 (2.0–14.0) | 10.0 (4.0–25.0) | 4.0 (2.0–9.0) | 3.0 (1.0–14.0) | 5.5 (2.0–12.0) | <0.001 | |
| Anxiety (GAD-7 score≥8) | 479 (24.7) | 99 (15.8) | 16 (29.6) | 44 (17.7) | 60 (40.5) | 48 (25.7) | 57 (39.9) | 24 (30.4) | 23 (37.7) | 108 (27.6) | <0.001 | |
| Depression (PHQ-9 score≥10) | 185 (9.5) | 41 (6.5) | 8 (14.8) | 11 (4.4) | 25 (16.9) | 21 (11.2) | 27 (18.9) | 9 (11.4) | 9 (14.8) | 34 (8.7) | <0.001 | |
| Cutaneous allodynia (ASC-12 score≥3) | 469 (24.2) | 70 (11.2) | 18 (33.3) | 41 (16.5) | 77 (52.0) | 52 (27.8) | 65 (45.5) | 26 (32.9) | 20 (32.8) | 100 (25.5) | <0.001 | |
| Fatigue (FSS score≥4) | 1,054 (54.4) | 274 (43.8) | 28 (51.9) | 117 (47.2) | 109 (73.6) | 118 (63.1) | 108 (75.5) | 41 (51.9) | 33 (54.1) | 226 (57.7) | <0.001 | |
| Excessive daytime sleepiness (ESS score≥11) | 450 (23.2) | 117 (18.7) | 13 (24.1) | 58 (23.4) | 38 (25.7) | 47 (25.1) | 48 (33.6) | 19 (24.1) | 18 (29.5) | 92 (23.5) | 0.020 | |
| Fibromyalgia syndrome | 162 (8.4) | 31 (5.0) | 8 (14.8) | 11 (4.4) | 26 (17.6) | 19 (10.2) | 24 (16.8) | 8 (10.1) | 7 (11.5) | 28 (7.1) | <0.001 | |
| Poor sleep quality (PSQI score≥8.5) | 335 (17.3) | 81 (12.9) | 13 (24.1) | 26 (10.5) | 47 (31.8) | 34 (18.2) | 42 (29.4) | 15 (19.0) | 13 (21.3) | 64 (16.3) | <0.001 | |
| Insomnia (ISI score≥15) | 127 (6.6) | 35 (5.6) | 5 (9.3) | 9 (3.6) | 24 (16.2) | 7 (3.7) | 12 (8.4) | 6 (7.6) | 3 (4.9) | 26 (6.6) | <0.001 | |
| ICHD-3 headache diagnosis | ||||||||||||
| Migraine | 170 (8.8) | 0 (0.0) | 0 (0.0) | 0 (0.0) | 147 (99.3) | 23 (12.3) | 0 (0.0) | 0 (0.0) | 0 (0.0) | 0 (0.0) | <0.001 | |
| Probable migraine | 337 (17.4) | 16 (2.6) | 0 (0.0) | 34 (13.7) | 0 (0.0) | 135 (72.2) | 127 (88.8) | 8 (10.1) | 0 (0.0) | 17 (4.3) | <0.001 | |
| Tension-type headache | 954 (49.2) | 588 (93.9) | 0 (0.0) | 0 (0.0) | 1 (0.7) | 0 (0.0) | 0 (0.0) | 0 (0.0) | 61 (100.0) | 304 (77.6) | <0.001 | |
| Other headache | 477 (24.6) | 22 (3.5) | 54 (100.0) | 214 (86.3) | 0 (0.0) | 29 (15.5) | 16 (11.2) | 71 (89.9) | 0 (0.0) | 71 (18.1) | <0.001 | |
| Medication overuse headache | 29 (1.5) | 2 (0.3) | 3 (5.6) | 2 (0.8) | 8 (5.4) | 5 (2.7) | 7 (4.9) | 0 (0.0) | 1 (1.6) | 1 (0.3) | <0.001 |
df, degrees of freedom; AIC, Akaike information criterion; BIC, Bayesian information criterion; LMR, Lo–Mendell–Rubin likelihood ratio test.
Values are presented as number (%) or mean±standard deviation. Pairwise comparison with Bonferroni correction; Significant p-values with Age: none, Sex: 1 vs. 4, 1 vs. 6, 1 vs. 9, 3 vs. 4, 4 vs. 5, 4 vs. 7, 4 vs. 9, BMI: 1 vs. 4. BMI, body mass index.
Values are presented as number (%). Pairwise comparisons with Bonferroni correction are provided in the supplementary tables ( ICHD-3, International Classification of Headache Disorders, 3rd edition.
Values are presented as number (%) or median (interquartile range). Pairwise comparisons with Bonferroni correction are provided in the supplementary tables ( VARS, Visual Aura Rating Scale; HIT-6, Headache Impact Test-6; MIDAS, Migraine Disability Assessment; GAD-7, Generalized Anxiety Disorder-7; PHQ-9, Patient Health Questionnaire-9; ASC-12, Allodynia Symptom Checklist-12; FSS, Fatigue Severity Scale; ESS, Epworth Sleepiness Scale; PSQI, Pittsburgh Sleep Quality Index; ISI, Insomnia Severity Index; ICHD-3, International Classification of Headache Disorders, 3rd edition.
Table 1.
Table 2.
Table 3.
Table 4.
TOP

